

Intracranial hemorrhage alters scalp potential distribution in bioimpedance cerebral monitoring: Preliminary results from FEM simulation on a realistic head model and human subjects
- PMID: 26843231
- PMCID: PMC4715008
- DOI: 10.1118/1.4939256
Intracranial hemorrhage alters scalp potential distribution in bioimpedance cerebral monitoring: Preliminary results from FEM simulation on a realistic head model and human subjects
Abstract
Purpose: Current diagnostic neuroimaging for detection of intracranial hemorrhage (ICH) is limited to fixed scanners requiring patient transport and extensive infrastructure support. ICH diagnosis would therefore benefit from a portable diagnostic technology, such as electrical bioimpedance (EBI). Through simulations and patient observation, the authors assessed the influence of unilateral ICH hematomas on quasisymmetric scalp potential distributions in order to establish the feasibility of EBI technology as a potential tool for early diagnosis.
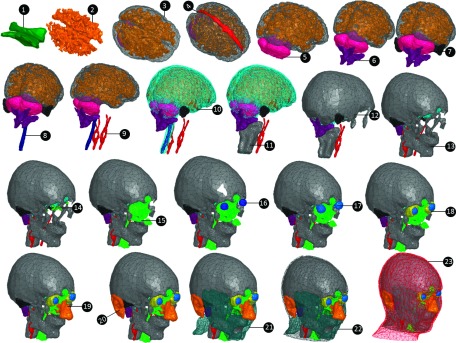
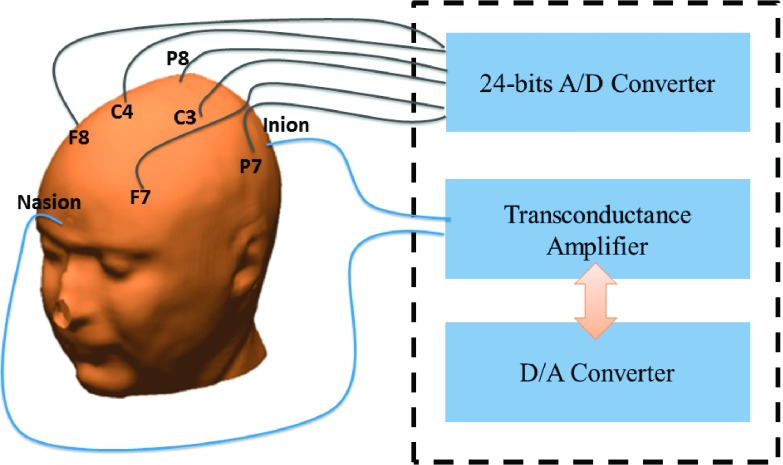
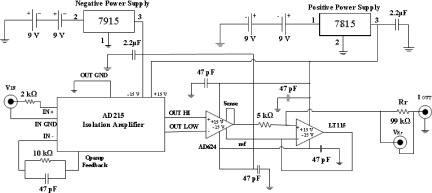
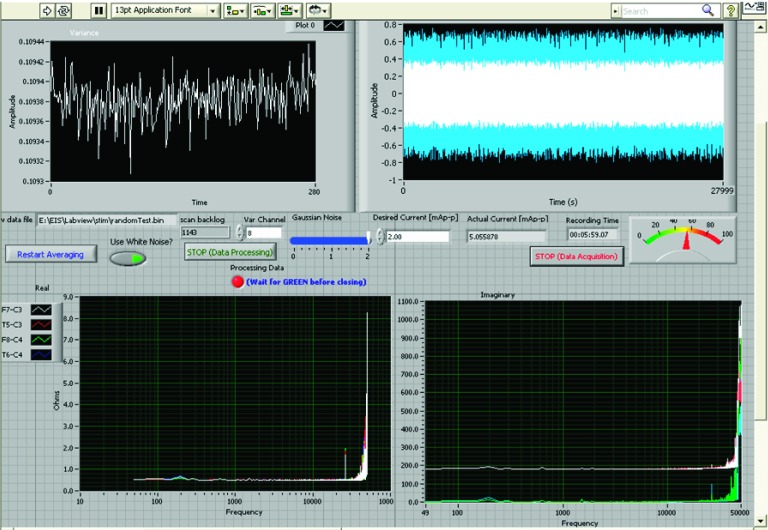
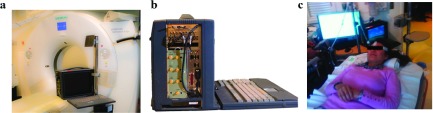
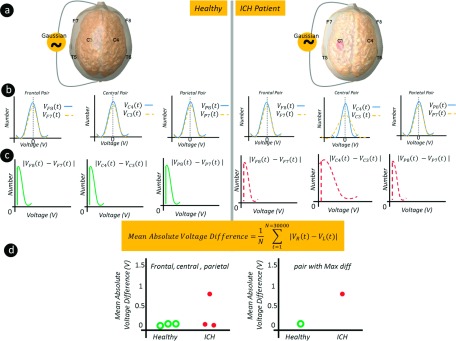
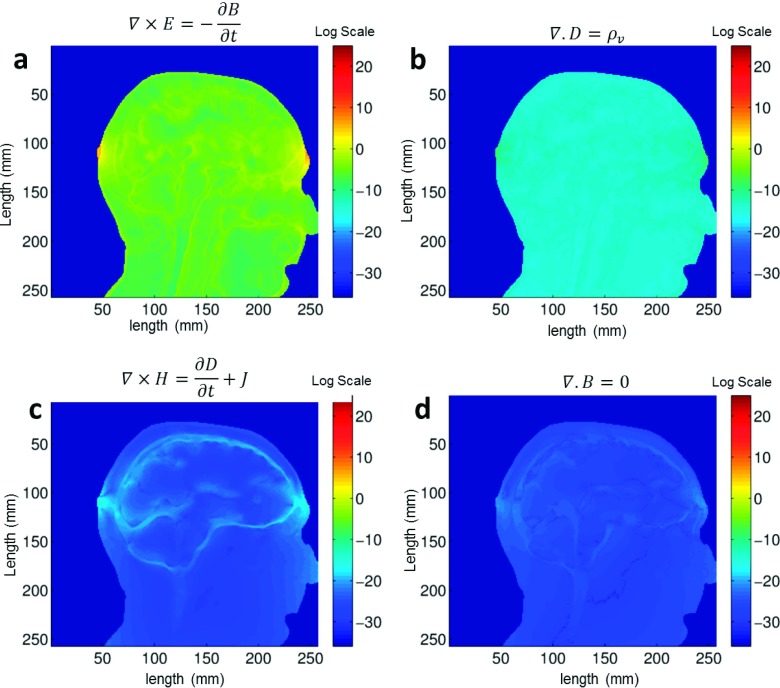
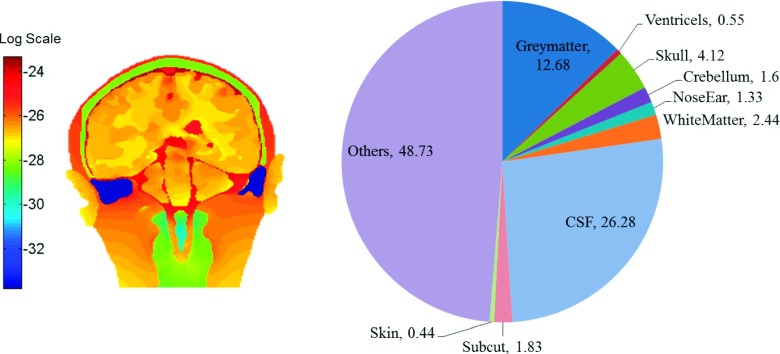
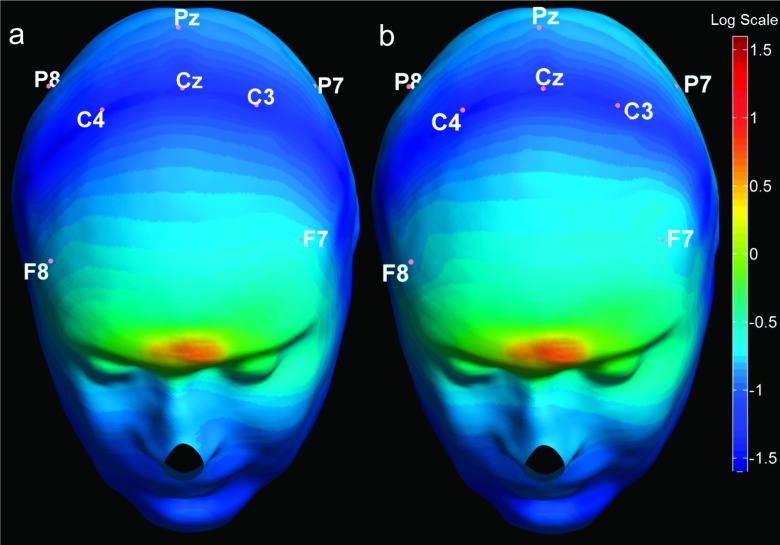
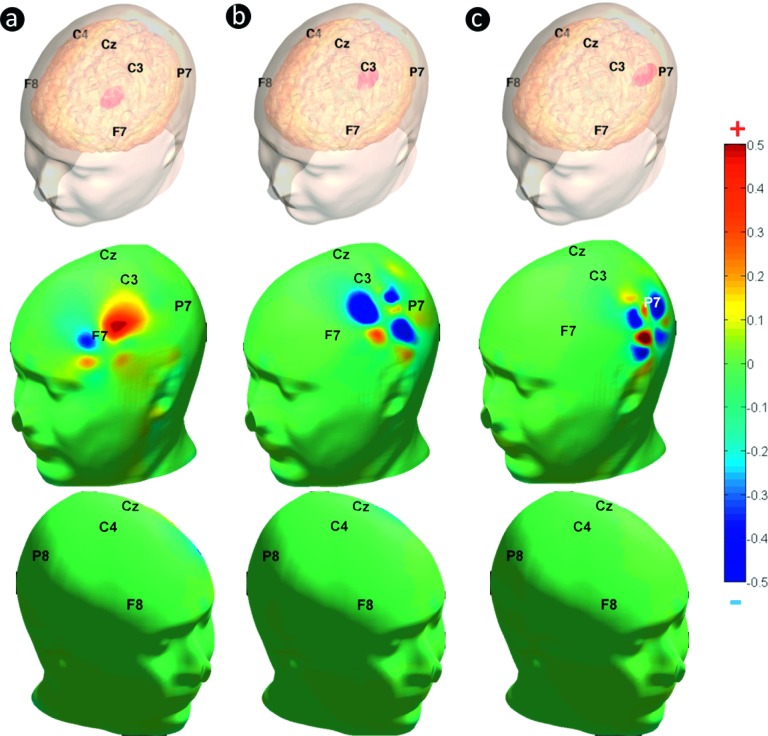
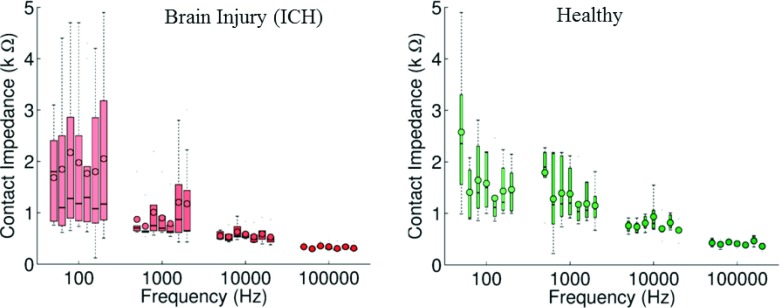
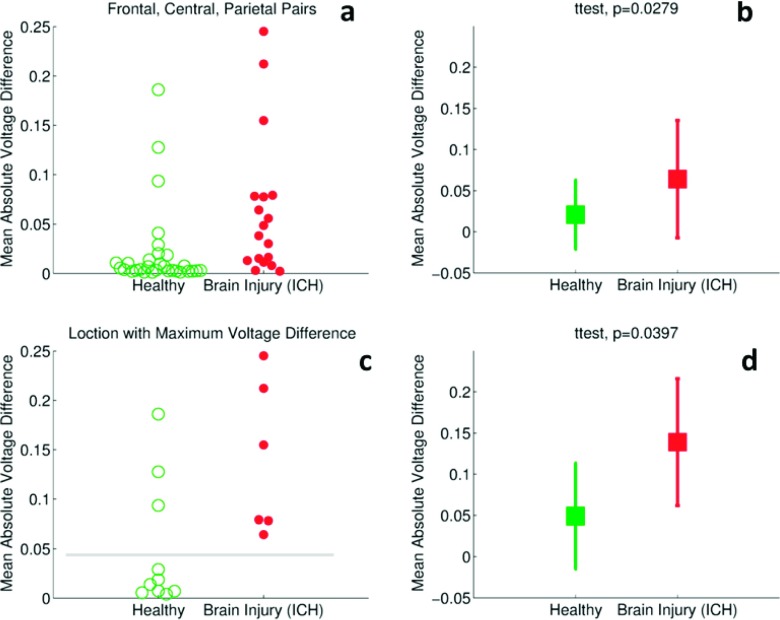
Methods: Finite element method (FEM) simulations and experimental left-right hemispheric scalp potential differences of healthy and damaged brains were compared with respect to the asymmetry caused by ICH lesions on quasisymmetric scalp potential distributions. In numerical simulations, this asymmetry was measured at 25 kHz and visualized on the scalp as the normalized potential difference between the healthy and ICH damaged models. Proof-of-concept simulations were extended in a pilot study of experimental scalp potential measurements recorded between 0 and 50 kHz with the authors' custom-made bioimpedance spectrometer. Mean left-right scalp potential differences recorded from the frontal, central, and parietal brain regions of ten healthy control and six patients suffering from acute/subacute ICH were compared. The observed differences were measured at the 5% level of significance using the two-sample Welch t-test.
Results: The 3D-anatomically accurate FEM simulations showed that the normalized scalp potential difference between the damaged and healthy brain models is zero everywhere on the head surface, except in the vicinity of the lesion, where it can vary up to 5%. The authors' preliminary experimental results also confirmed that the left-right scalp potential difference in patients with ICH (e.g., 64 mV) is significantly larger than in healthy subjects (e.g., 20.8 mV; P < 0.05).
Conclusions: Realistic, proof-of-concept simulations confirmed that ICH affects quasisymmetric scalp potential distributions. Pilot clinical observations with the authors' custom-made bioimpedance spectrometer also showed higher left-right potential differences in the presence of ICH, similar to those of their simulations, that may help to distinguish healthy subjects from ICH patients. Although these pilot clinical observations are in agreement with the computer simulations, the small sample size of this study lacks statistical power to exclude the influence of other possible confounders such as age, sex, and electrode positioning. The agreement with previously published simulation-based and clinical results, however, suggests that EBI technology may be potentially useful for ICH detection.
Figures
Similar articles
-
Novel Electrode Placement in Electrical Bioimpedance-Based Stroke Detection: Effects on Current Penetration and Injury Characterization in a Finite Element Model.IEEE Trans Biomed Eng. 2022 May;69(5):1745-1757. doi: 10.1109/TBME.2021.3129734. Epub 2022 Apr 21. IEEE Trans Biomed Eng. 2022. PMID: 34813463 Free PMC article.
-
Monitoring brain damage using bioimpedance technique in a 3D numerical model of the head.Med Eng Phys. 2015 May;37(5):453-9. doi: 10.1016/j.medengphy.2015.02.011. Epub 2015 Mar 11. Med Eng Phys. 2015. PMID: 25771429
-
A cortical potential imaging study from simultaneous extra- and intracranial electrical recordings by means of the finite element method.Neuroimage. 2006 Jul 15;31(4):1513-24. doi: 10.1016/j.neuroimage.2006.02.027. Epub 2006 May 2. Neuroimage. 2006. PMID: 16631381 Free PMC article.
-
Body fluid volumes measurements by impedance: A review of bioimpedance spectroscopy (BIS) and bioimpedance analysis (BIA) methods.Med Eng Phys. 2008 Dec;30(10):1257-69. doi: 10.1016/j.medengphy.2008.06.009. Epub 2008 Aug 3. Med Eng Phys. 2008. PMID: 18676172 Review.
-
Fetal intracranial hemorrhage (fetal stroke): report of four antenatally diagnosed cases and review of the literature.Taiwan J Obstet Gynecol. 2006 Jun;45(2):135-41. doi: 10.1016/S1028-4559(09)60211-4. Taiwan J Obstet Gynecol. 2006. PMID: 17197354 Review.
Cited by
-
Novel Electrode Placement in Electrical Bioimpedance-Based Stroke Detection: Effects on Current Penetration and Injury Characterization in a Finite Element Model.IEEE Trans Biomed Eng. 2022 May;69(5):1745-1757. doi: 10.1109/TBME.2021.3129734. Epub 2022 Apr 21. IEEE Trans Biomed Eng. 2022. PMID: 34813463 Free PMC article.
-
On-site Rapid Diagnosis of Intracranial Hematoma using Portable Multi-slice Microwave Imaging System.Sci Rep. 2016 Nov 29;6:37620. doi: 10.1038/srep37620. Sci Rep. 2016. PMID: 27897197 Free PMC article.
-
A Study on the Feasibility of the Deep Brain Stimulation (DBS) Electrode Localization Based on Scalp Electric Potential Recordings.Front Physiol. 2019 Jan 4;9:1788. doi: 10.3389/fphys.2018.01788. eCollection 2018. Front Physiol. 2019. PMID: 30662407 Free PMC article.
References
-
- Rosamond W., Flegal K., Furie K., Go A., Greenlund K., Haase N., Hailpern S. M., Ho M., Howard V., Kissela B., Kittner S., Lloyd-Jones D., McDermott M., Meigs J., Moy C., Nichol G., O’Donnell C., Roger V., Sorlie P., Steinberger J., Thom T., Wilson M., and Hong Y., “Heart disease and stroke statistics–2008 update: A report from the American Heart Association Statistics Committee and Stroke Statistics Subcommittee,” Circulation 117(4), e25–e146 (2008).10.1161/CIRCULATIONAHA.107.187998 - DOI - PubMed
-
- Go. A. S., Mozaffarian D., Roger V. L., Benjamin E. J., Berry J. D., Blaha M. J., Dai S., Ford E. S., Fox C. S., and Franco S., “Heart disease and stroke statistics–2014 update: A report from the American Heart Association,” Circulation 129(3), e28–e292 (2014).10.1161/01.cir.0000441139.02102.80 - DOI - PMC - PubMed
Publication types
MeSH terms
Grants and funding
LinkOut - more resources
Full Text Sources
Other Literature Sources
