

Nonthermal ablation of deep brain targets: A simulation study on a large animal model
- PMID: 26843248
- PMCID: PMC4723413
- DOI: 10.1118/1.4939809
Nonthermal ablation of deep brain targets: A simulation study on a large animal model
Abstract
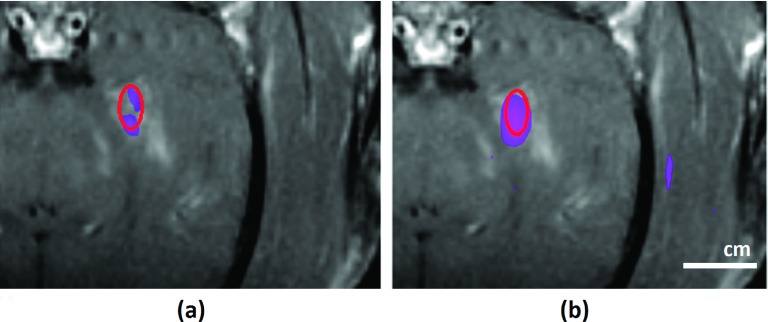
Purpose: Thermal ablation with transcranial MRI-guided focused ultrasound (FUS) is currently limited to central brain targets because of heating and other beam effects caused by the presence of the skull. Recently, it was shown that it is possible to ablate tissues without depositing thermal energy by driving intravenously administered microbubbles to inertial cavitation using low-duty-cycle burst sonications. A recent study demonstrated that this ablation method could ablate tissue volumes near the skull base in nonhuman primates without thermally damaging the nearby bone. However, blood-brain disruption was observed in the prefocal region, and in some cases, this region contained small areas of tissue damage. The objective of this study was to analyze the experimental model with simulations and to interpret the cause of these effects.
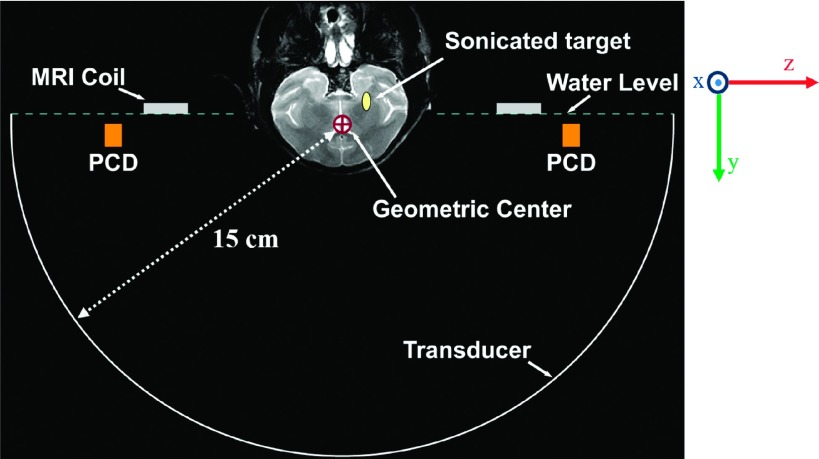
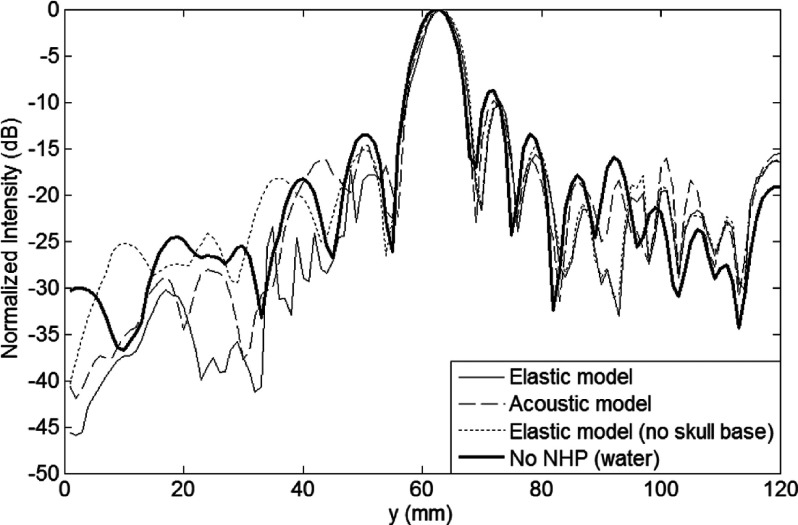
Methods: The authors simulated prior experiments where nonthermal ablation was performed in the brain in anesthetized rhesus macaques using a 220 kHz clinical prototype transcranial MRI-guided FUS system. Low-duty-cycle sonications were applied at deep brain targets with the ultrasound contrast agent Definity. For simulations, a 3D pseudospectral finite difference time domain tool was used. The effects of shear mode conversion, focal steering, skull aberrations, nonlinear propagation, and the presence of skull base on the pressure field were investigated using acoustic and elastic wave propagation models.
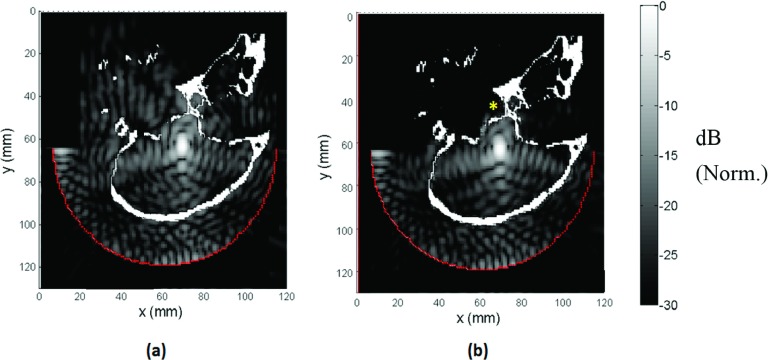
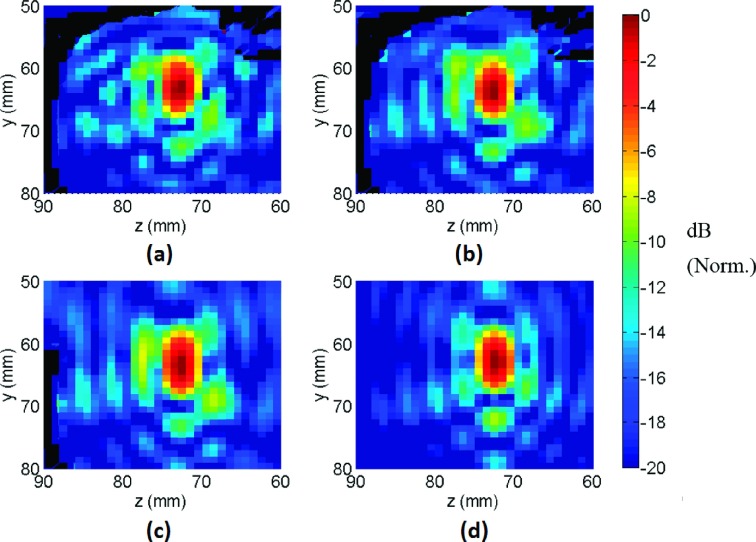
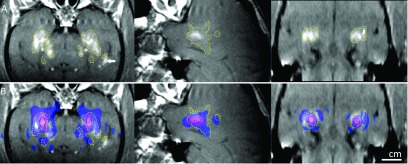
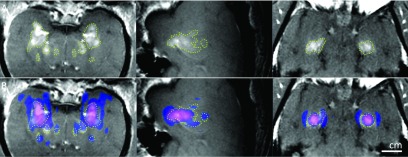
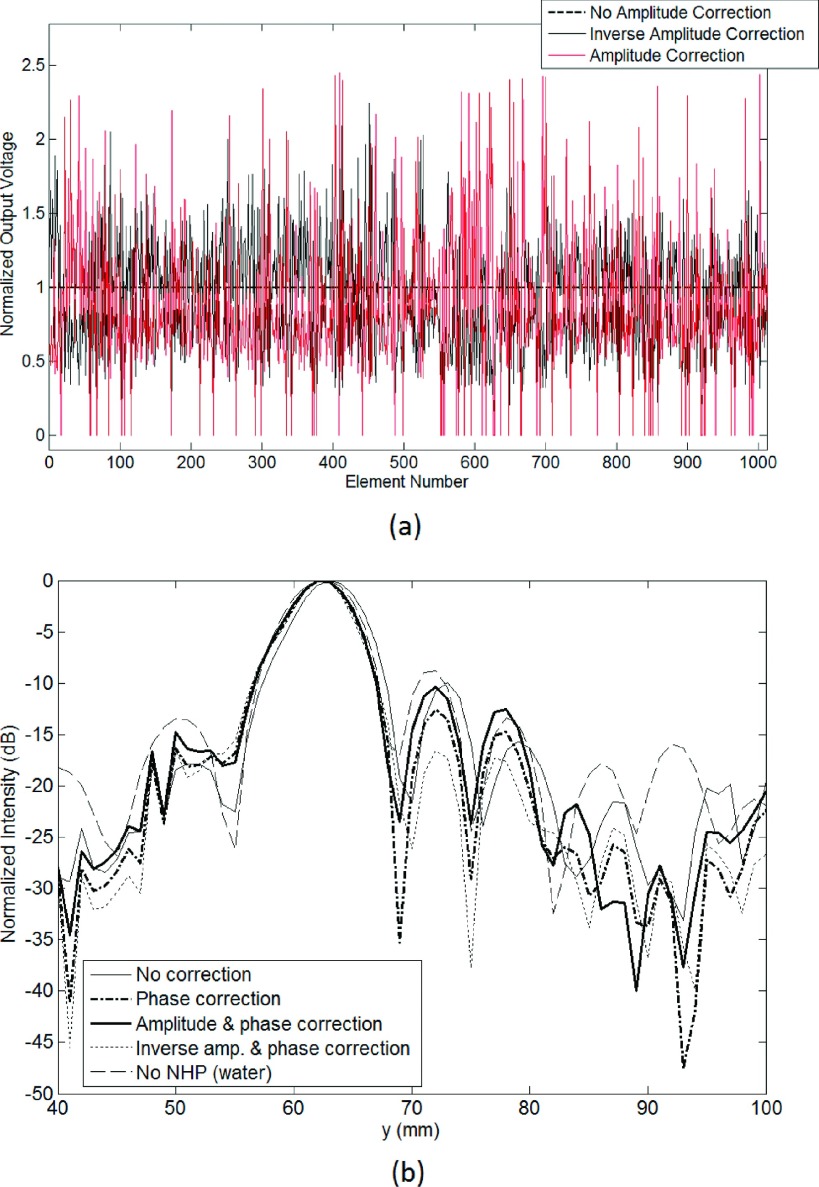
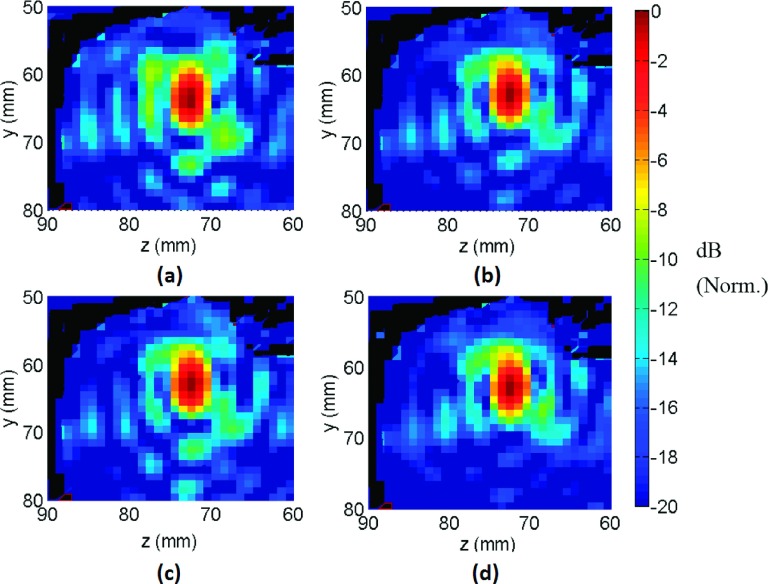
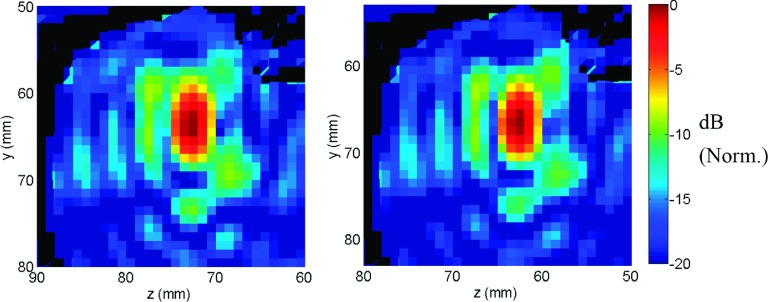
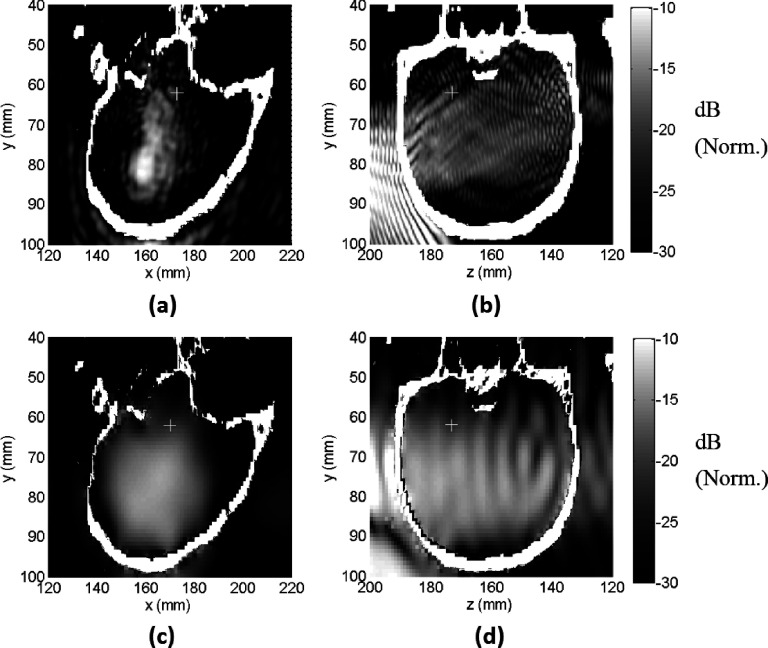
Results: The simulation results were in agreement with the experimental findings in the prefocal region. In the postfocal region, however, side lobes were predicted by the simulations, but no effects were evident in the experiments. The main beam was not affected by the different simulated scenarios except for a shift of about 1 mm in peak position due to skull aberrations. However, the authors observed differences in the volume, amplitude, and distribution of the side lobes. In the experiments, a single element passive cavitation detector was used to measure the inertial cavitation threshold and to determine the pressure amplitude to use for ablation. Simulations of the detector's acoustic field suggest that its maximum sensitivity was in the lower part of the main beam, which may have led to excessive exposure levels in the experiments that may have contributed to damage in the prefocal area.
Conclusions: Overall, these results suggest that case-specific full wave simulations before the procedure can be useful to predict the focal and the prefocal side lobes and the extent of the resulting bioeffects produced by nonthermal ablation. Such simulations can also be used to optimally position passive cavitation detectors. The disagreement between the simulations and the experiments in the postfocal region may have been due to shielding of the ultrasound field due to microbubble activity in the focal region. Future efforts should include the effects of microbubble activity and vascularization on the pressure field.
Figures
Similar articles
-
Cavitation-enhanced nonthermal ablation in deep brain targets: feasibility in a large animal model.J Neurosurg. 2016 May;124(5):1450-9. doi: 10.3171/2015.4.JNS142862. Epub 2015 Sep 18. J Neurosurg. 2016. PMID: 26381252 Free PMC article.
-
Intracranial inertial cavitation threshold and thermal ablation lesion creation using MRI-guided 220-kHz focused ultrasound surgery: preclinical investigation.J Neurosurg. 2015 Jan;122(1):152-61. doi: 10.3171/2014.9.JNS14541. J Neurosurg. 2015. PMID: 25380106
-
Nonthermal ablation in the rat brain using focused ultrasound and an ultrasound contrast agent: long-term effects.J Neurosurg. 2016 Dec;125(6):1539-1548. doi: 10.3171/2015.10.JNS151525. Epub 2016 Feb 5. J Neurosurg. 2016. PMID: 26848919 Free PMC article.
-
Ultrasound Ablation in Neurosurgery: Current Clinical Applications and Future Perspectives.Neurosurgery. 2020 Jul 1;87(1):1-10. doi: 10.1093/neuros/nyz407. Neurosurgery. 2020. PMID: 31745558 Review.
-
Non-invasive transcranial brain ablation with high-intensity focused ultrasound.Front Neurol Neurosci. 2015;36:94-105. doi: 10.1159/000366241. Epub 2014 Dec 22. Front Neurol Neurosci. 2015. PMID: 25531666 Review.
Cited by
-
Neuromodulation with single-element transcranial focused ultrasound in human thalamus.Hum Brain Mapp. 2018 May;39(5):1995-2006. doi: 10.1002/hbm.23981. Epub 2018 Jan 29. Hum Brain Mapp. 2018. PMID: 29380485 Free PMC article.
-
Preclinical evaluation of a low-frequency transcranial MRI-guided focused ultrasound system in a primate model.Phys Med Biol. 2016 Nov 7;61(21):7664-7687. doi: 10.1088/0031-9155/61/21/7664. Epub 2016 Oct 14. Phys Med Biol. 2016. PMID: 27740941 Free PMC article.
-
Fast and high temperature hyperthermia coupled with radiotherapy as a possible new treatment for glioblastoma.J Ther Ultrasound. 2016 Dec 8;4:32. doi: 10.1186/s40349-016-0078-3. eCollection 2016. J Ther Ultrasound. 2016. PMID: 27980785 Free PMC article.
-
Improving Sonication Efficiency in Transcranial MR-Guided Focused Ultrasound Treatment: A Patient-Data Simulation Study.Bioengineering (Basel). 2023 Dec 26;11(1):27. doi: 10.3390/bioengineering11010027. Bioengineering (Basel). 2023. PMID: 38247904 Free PMC article.
-
Advances in acoustic monitoring and control of focused ultrasound-mediated increases in blood-brain barrier permeability.Br J Radiol. 2019 Apr;92(1096):20180601. doi: 10.1259/bjr.20180601. Epub 2019 Feb 28. Br J Radiol. 2019. PMID: 30507302 Free PMC article. Review.
References
-
- Jeanmonod D., Werner B., Morel A., Michels L., Zadicario E., Schiff G., and Martin E., “Transcranial magnetic resonance imaging–guided focused ultrasound: Noninvasive central lateral thalamotomy for chronic neuropathic pain,” Neurosurg. Focus 32(1), E1 (2011).10.3171/2011.10.FOCUS11248 - DOI - PubMed
Publication types
MeSH terms
Grants and funding
LinkOut - more resources
Full Text Sources
Other Literature Sources
