

Cherenkov imaging method for rapid optimization of clinical treatment geometry in total skin electron beam therapy
- PMID: 26843259
- PMCID: PMC4744235
- DOI: 10.1118/1.4939880
Cherenkov imaging method for rapid optimization of clinical treatment geometry in total skin electron beam therapy
Abstract
Purpose: A method was developed utilizing Cherenkov imaging for rapid and thorough determination of the two gantry angles that produce the most uniform treatment plane during dual-field total skin electron beam therapy (TSET).
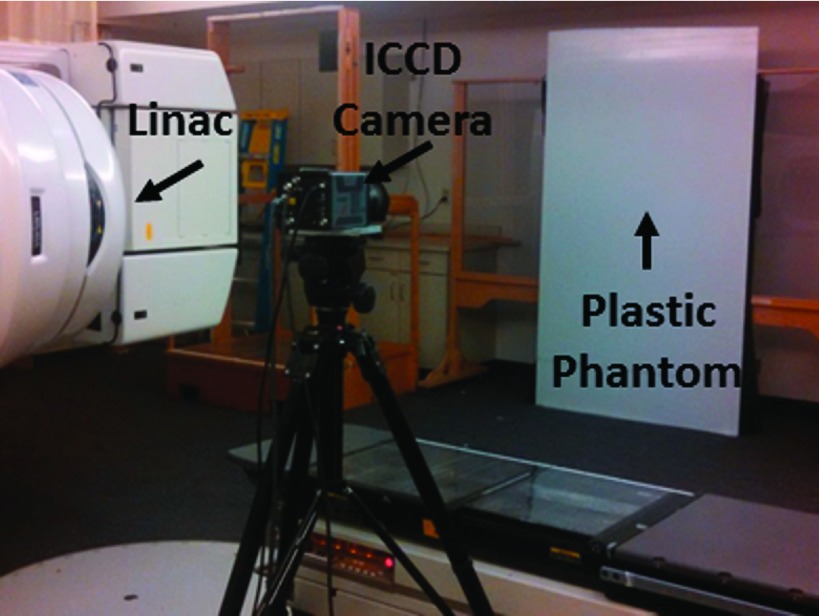
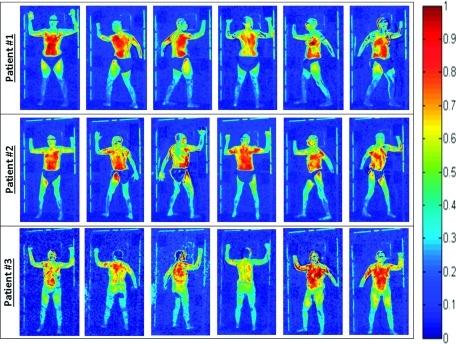
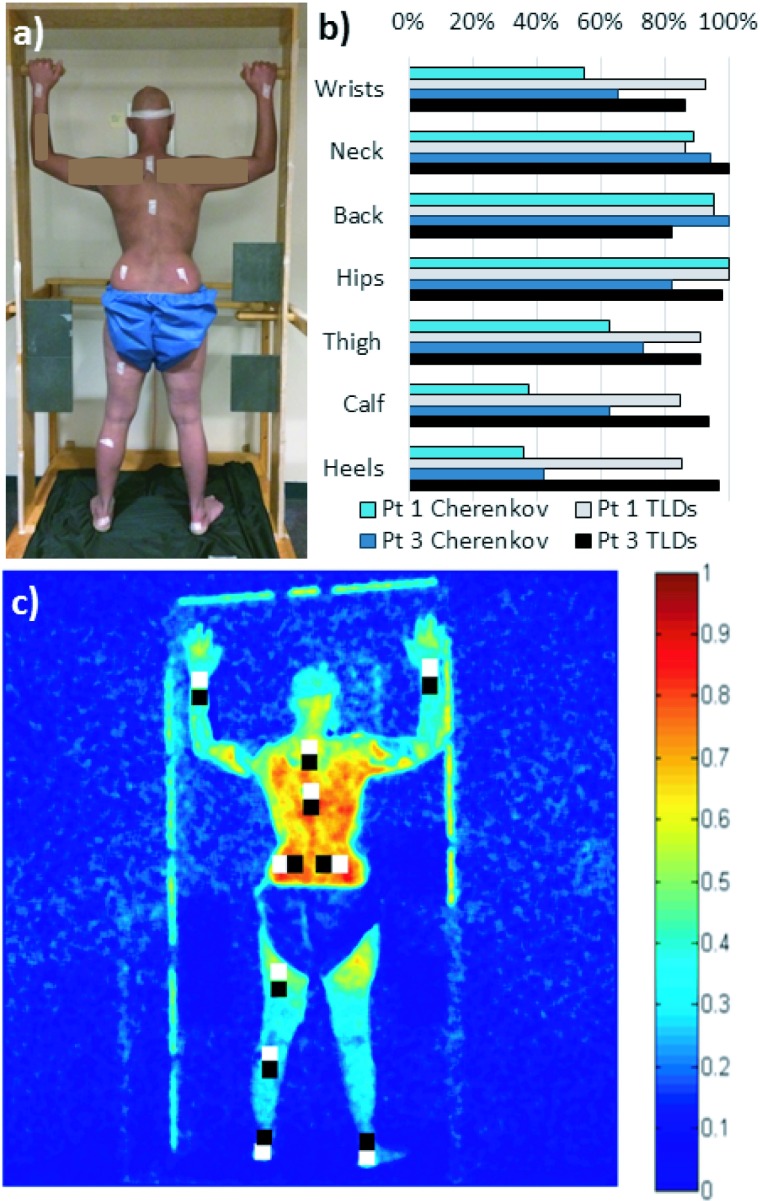
Methods: Cherenkov imaging was implemented to gather 2D measurements of relative surface dose from 6 MeV electron beams on a white polyethylene sheet. An intensified charge-coupled device camera time-gated to the Linac was used for Cherenkov emission imaging at sixty-two different gantry angles (1° increments, from 239.5° to 300.5°). Following a modified Stanford TSET technique, which uses two fields per patient position for full body coverage, composite images were created as the sum of two beam images on the sheet; each angle pair was evaluated for minimum variation across the patient region of interest. Cherenkov versus dose correlation was verified with ionization chamber measurements. The process was repeated at source to surface distance (SSD) = 441, 370.5, and 300 cm to determine optimal angle spread for varying room geometries. In addition, three patients receiving TSET using a modified Stanford six-dual field technique with 6 MeV electron beams at SSD = 441 cm were imaged during treatment.
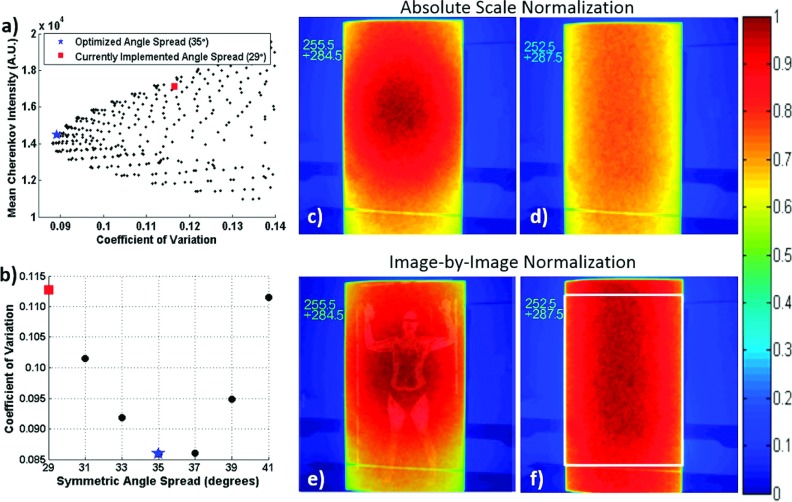
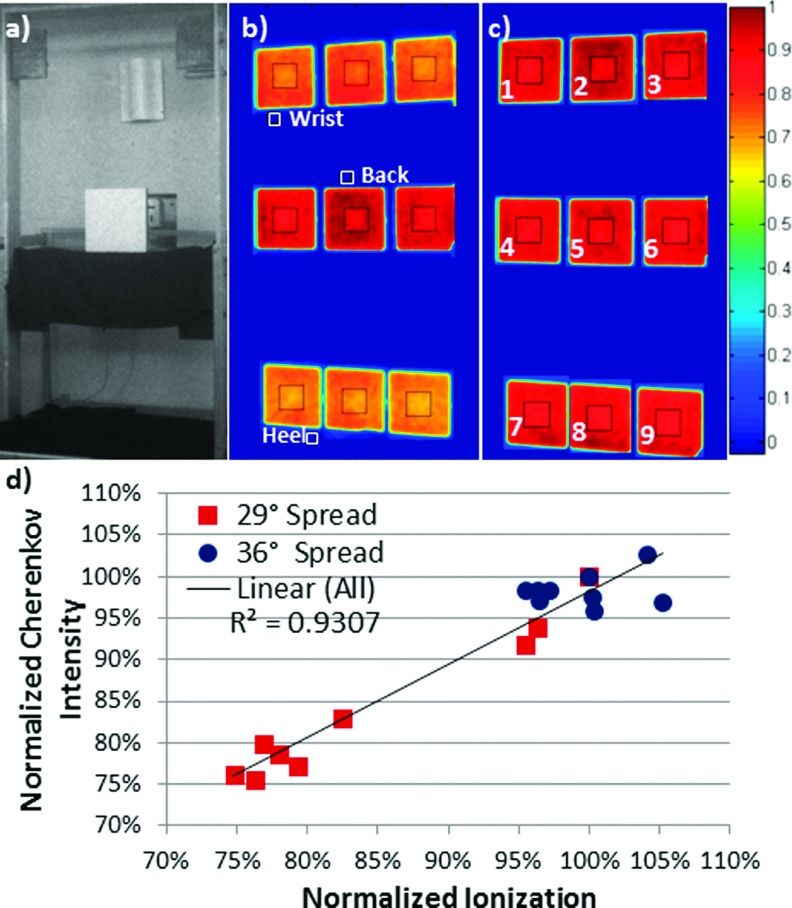
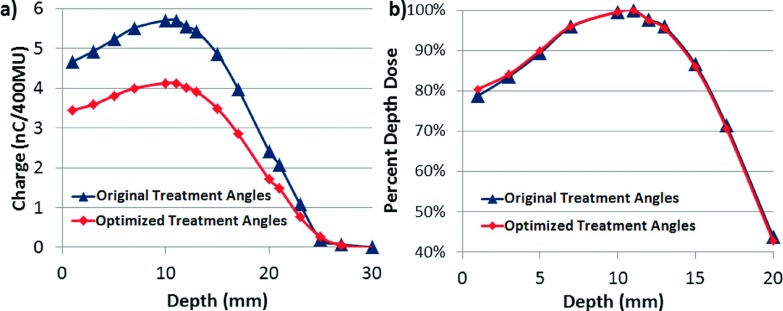
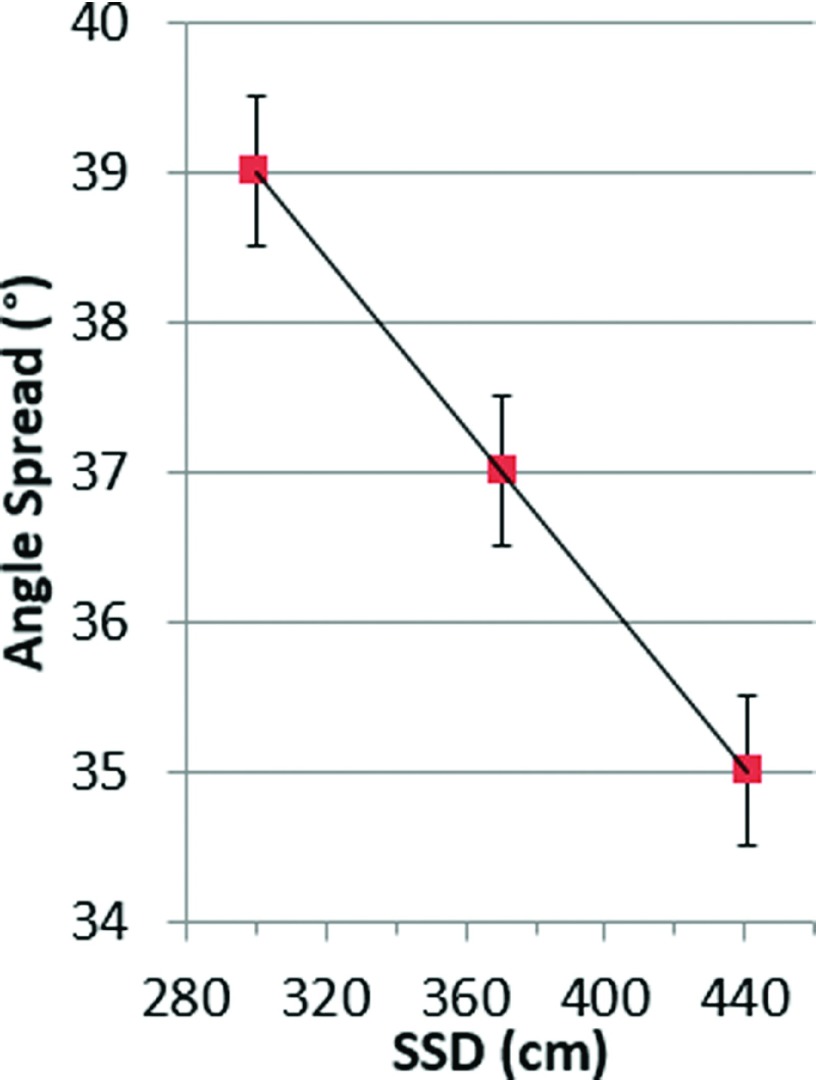
Results: As in previous studies, Cherenkov intensity was shown to directly correlate with dose for homogenous flat phantoms (R(2) = 0.93), making Cherenkov imaging an appropriate candidate to assess and optimize TSET setup geometry. This method provided dense 2D images allowing 1891 possible treatment geometries to be comprehensively analyzed from one data set of 62 single images. Gantry angles historically used for TSET at their institution were 255.5° and 284.5° at SSD = 441 cm; however, the angles optimized for maximum homogeneity were found to be 252.5° and 287.5° (+6° increase in angle spread). Ionization chamber measurements confirmed improvement in dose homogeneity across the treatment field from a range of 24.4% at the initial angles, to only 9.8% with the angles optimized. A linear relationship between angle spread and SSD was observed, ranging from 35° at 441 cm, to 39° at 300 cm, with no significant variation in percent-depth dose at midline (R(2) = 0.998). For patient studies, factors influencing in vivo correlation between Cherenkov intensity and measured surface dose are still being investigated.
Conclusions: Cherenkov intensity correlates to relative dose measured at depth of maximum dose in a uniform, flat phantom. Imaging of phantoms can thus be used to analyze and optimize TSET treatment geometry more extensively and rapidly than thermoluminescent dosimeters or ionization chambers. This work suggests that there could be an expanded role for Cherenkov imaging as a tool to efficiently improve treatment protocols and as a potential verification tool for routine monitoring of unique patient treatments.
Figures
Similar articles
-
Improving treatment geometries in total skin electron therapy: Experimental investigation of linac angles and floor scatter dose contributions using Cherenkov imaging.Med Phys. 2018 Jun;45(6):2639-2646. doi: 10.1002/mp.12917. Epub 2018 May 6. Med Phys. 2018. PMID: 29663425
-
Total skin electron therapy (TSET): a reimplementation using radiochromic films and IAEA TRS-398 code of practice.Med Phys. 2010 Jul;37(7):3510-7. doi: 10.1118/1.3442301. Med Phys. 2010. PMID: 20831057
-
Matching the dosimetry characteristics of a dual-field Stanford technique to a customized single-field Stanford technique for total skin electron therapy.Int J Radiat Oncol Biol Phys. 2004 Jul 1;59(3):872-85. doi: 10.1016/j.ijrobp.2004.02.046. Int J Radiat Oncol Biol Phys. 2004. PMID: 15183491
-
One Year of Clinic-Wide Cherenkov Imaging for Discovery of Quality Improvement Opportunities in Radiation Therapy.Pract Radiat Oncol. 2023 Jan-Feb;13(1):71-81. doi: 10.1016/j.prro.2022.06.009. Epub 2022 Jun 29. Pract Radiat Oncol. 2023. PMID: 35777728 Free PMC article. Review.
-
Robust Angle Selection in Particle Therapy.Front Oncol. 2021 Sep 21;11:715025. doi: 10.3389/fonc.2021.715025. eCollection 2021. Front Oncol. 2021. PMID: 34621672 Free PMC article. Review.
Cited by
-
Computational dose visualization & comparison in total skin electron treatment suggests superior coverage by the rotational versus the Stanford technique.J Med Imaging Radiat Sci. 2022 Dec;53(4):612-622. doi: 10.1016/j.jmir.2022.08.006. Epub 2022 Aug 28. J Med Imaging Radiat Sci. 2022. PMID: 36045017 Free PMC article.
-
Cherenkov-excited luminescence scanned imaging using scanned beam differencing and iterative deconvolution in dynamic plan radiation delivery in a human breast phantom geometry.Med Phys. 2019 Jul;46(7):3067-3077. doi: 10.1002/mp.13545. Epub 2019 May 18. Med Phys. 2019. PMID: 30980725 Free PMC article.
-
Time-gated scintillator imaging for real-time optical surface dosimetry in total skin electron therapy.Phys Med Biol. 2018 May 2;63(9):095009. doi: 10.1088/1361-6560/aaba19. Phys Med Biol. 2018. PMID: 29588437 Free PMC article.
-
[18F]fluoroethyltyrosine-induced Cerenkov Luminescence Improves Image-Guided Surgical Resection of Glioma.Theranostics. 2018 Jul 1;8(14):3991-4002. doi: 10.7150/thno.23709. eCollection 2018. Theranostics. 2018. PMID: 30083276 Free PMC article.
-
Rapid Multisite Remote Surface Dosimetry for Total Skin Electron Therapy: Scintillator Target Imaging.Int J Radiat Oncol Biol Phys. 2019 Mar 1;103(3):767-774. doi: 10.1016/j.ijrobp.2018.10.030. Epub 2018 Nov 10. Int J Radiat Oncol Biol Phys. 2019. PMID: 30419306 Free PMC article.
References
-
- Navi D., Riaz N., Levin Y. S., Sullivan N. C., Kim Y. H., and Hoppe R. T., “The Stanford University experience with conventional-dose, total skin electron-beam therapy in the treatment of generalized patch or plaque (T2) and tumor (T3) mycosis fungoides,” Arch. Dermatol. 147(5), 561–567 (2011).10.1001/archdermatol.2011.98 - DOI - PubMed
Publication types
MeSH terms
Grants and funding
LinkOut - more resources
Full Text Sources
Other Literature Sources
Research Materials
