. 2016 May 5;44(8):3695-712.
doi: 10.1093/nar/gkw057. Epub 2016 Feb 3.

The downregulation of the RNA-binding protein Staufen2 in response to DNA damage promotes apoptosis

Affiliations

The downregulation of the RNA-binding protein Staufen2 in response to DNA damage promotes apoptosis

Xin Zhang et al. Nucleic Acids Res. .

Abstract

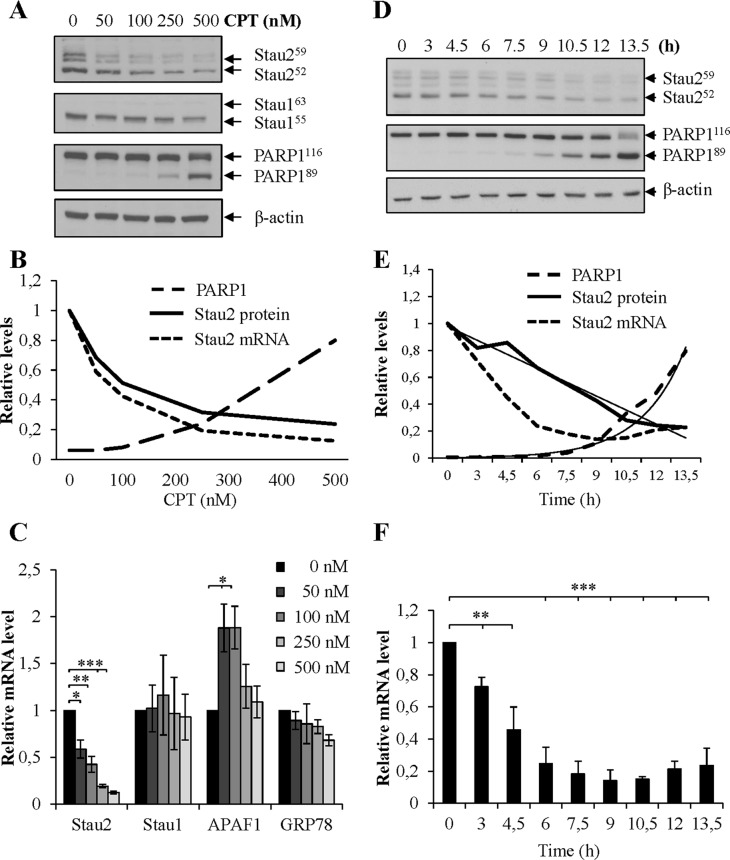
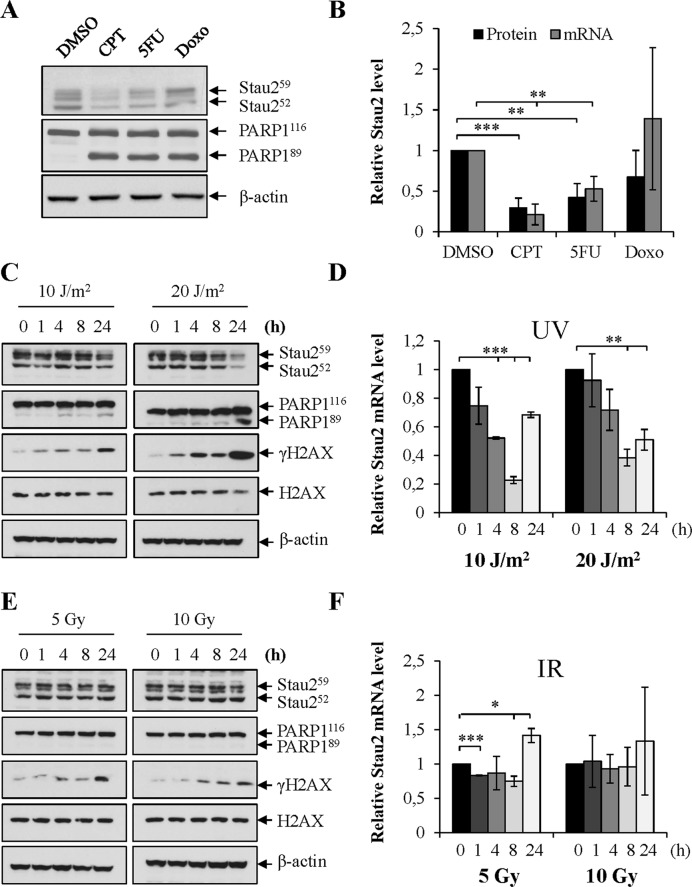
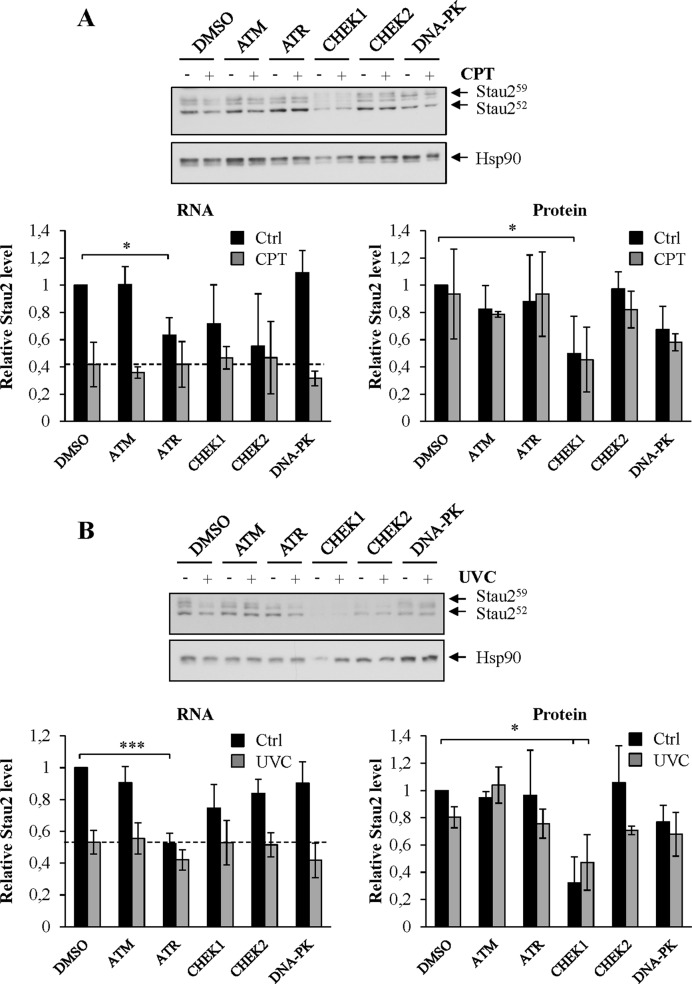
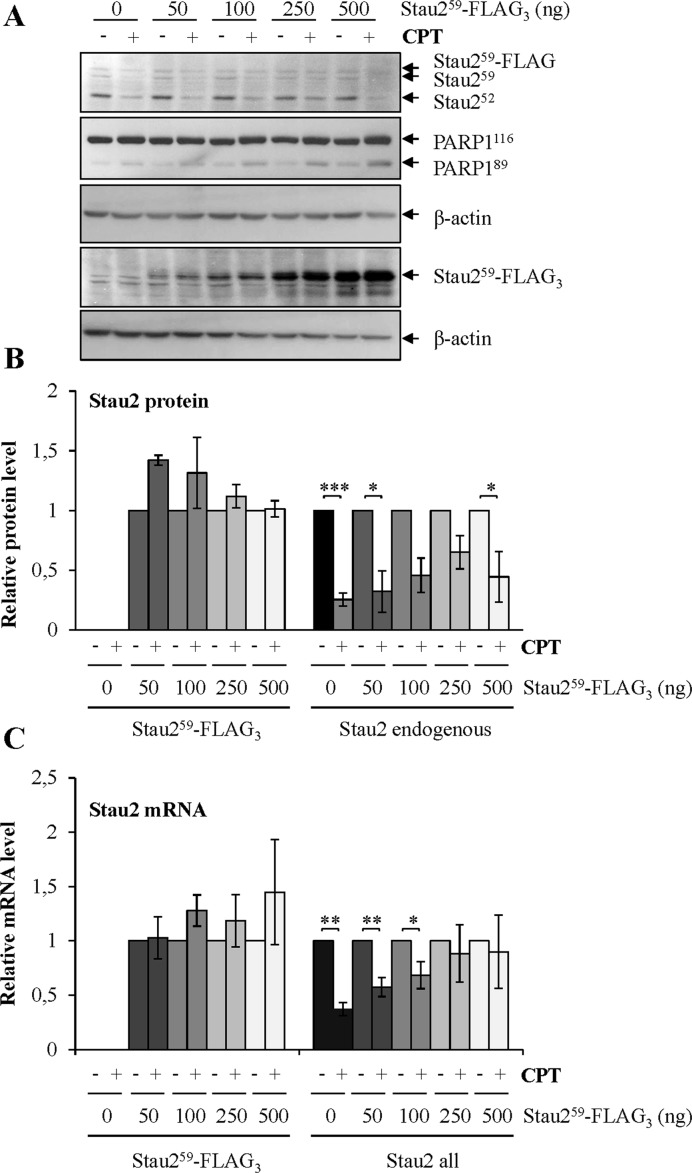
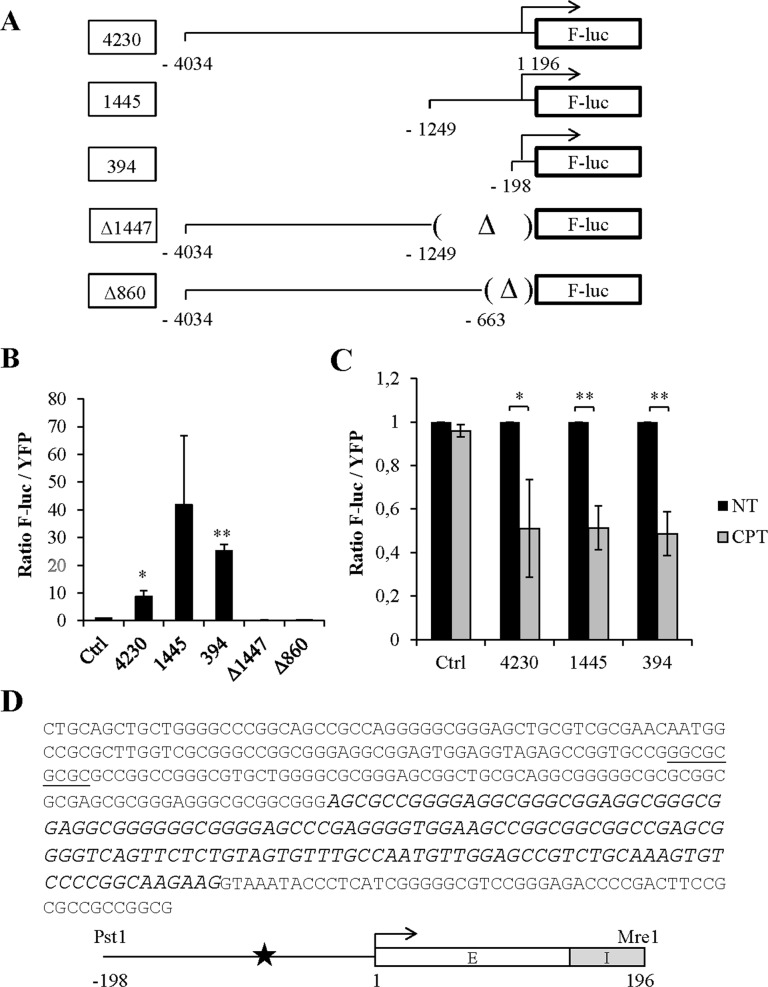
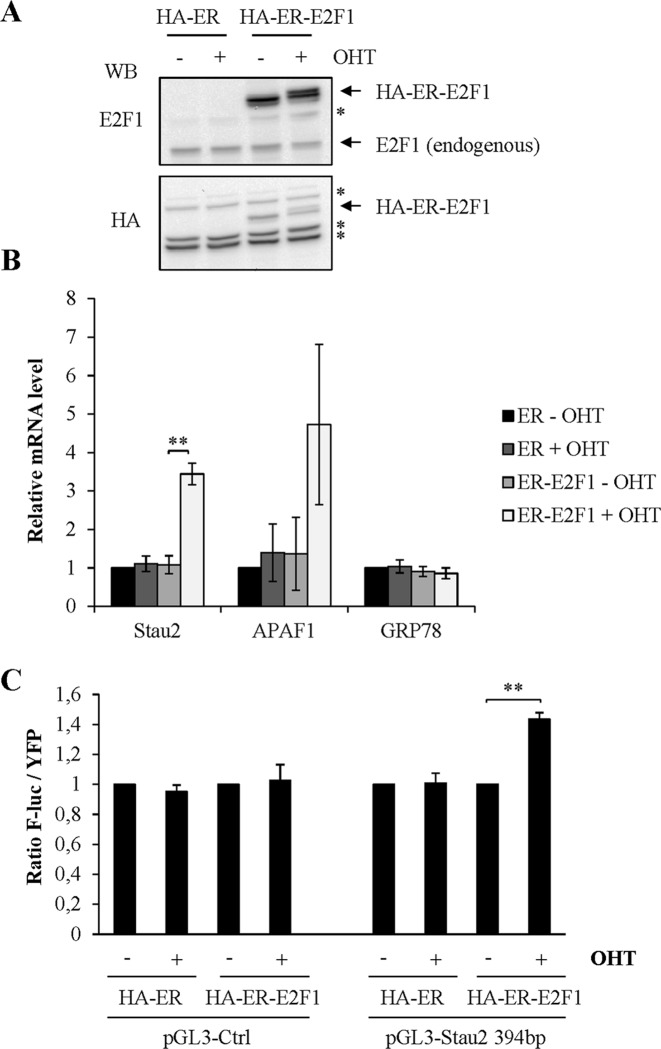
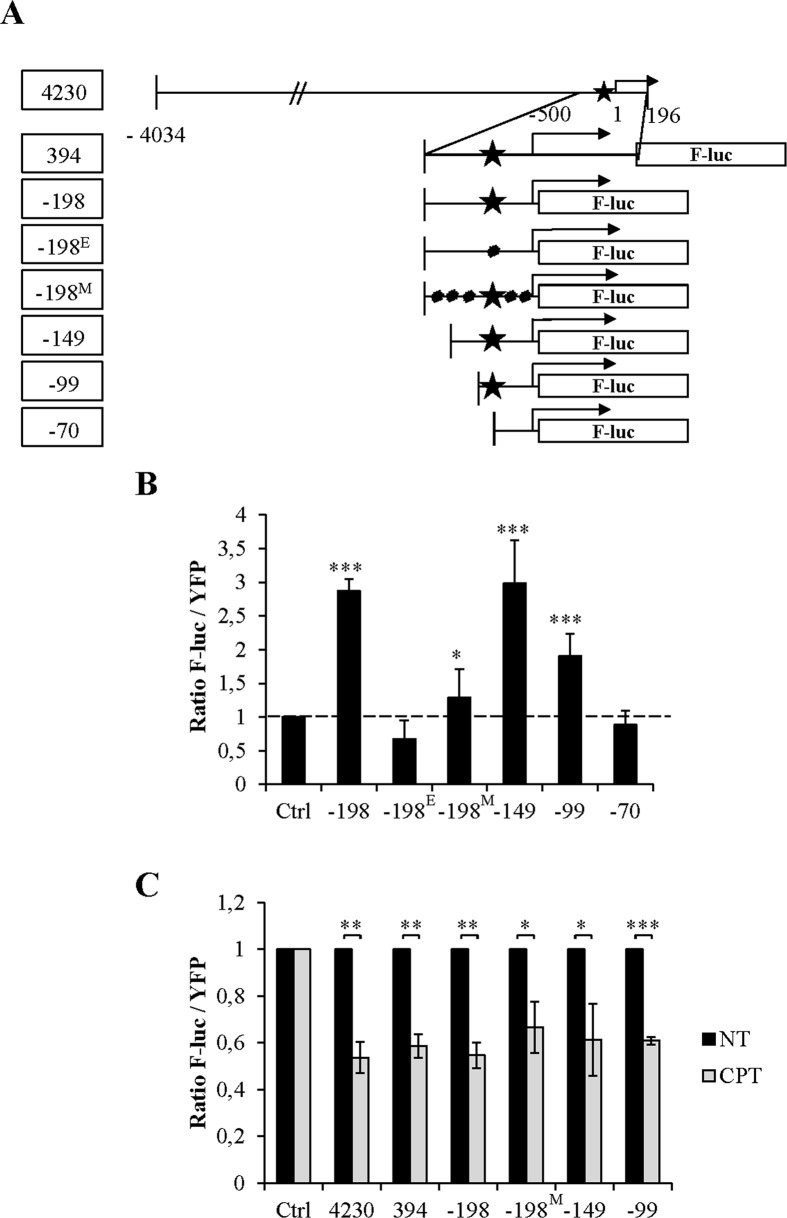
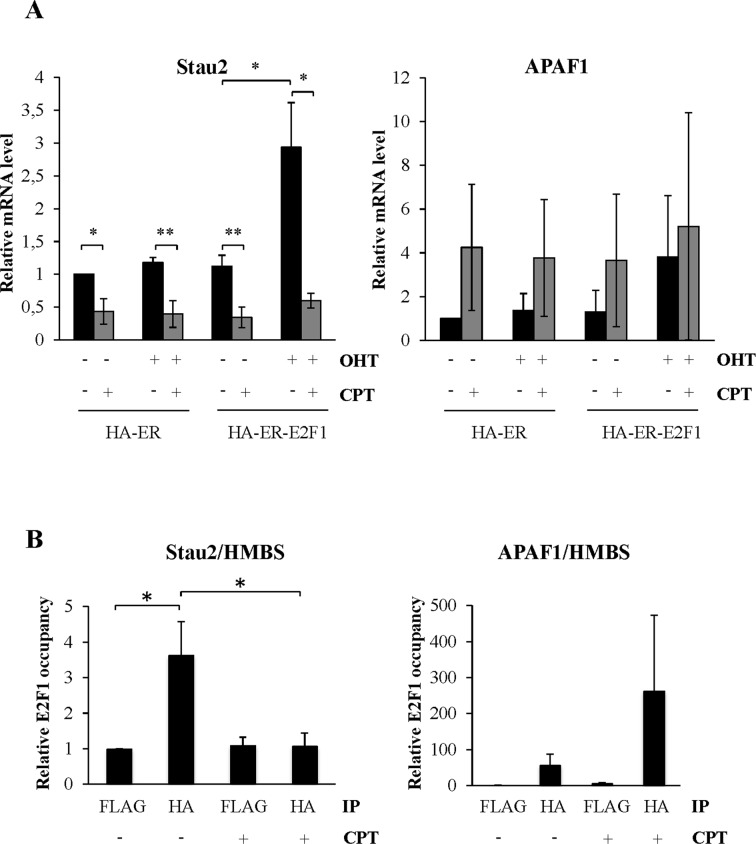
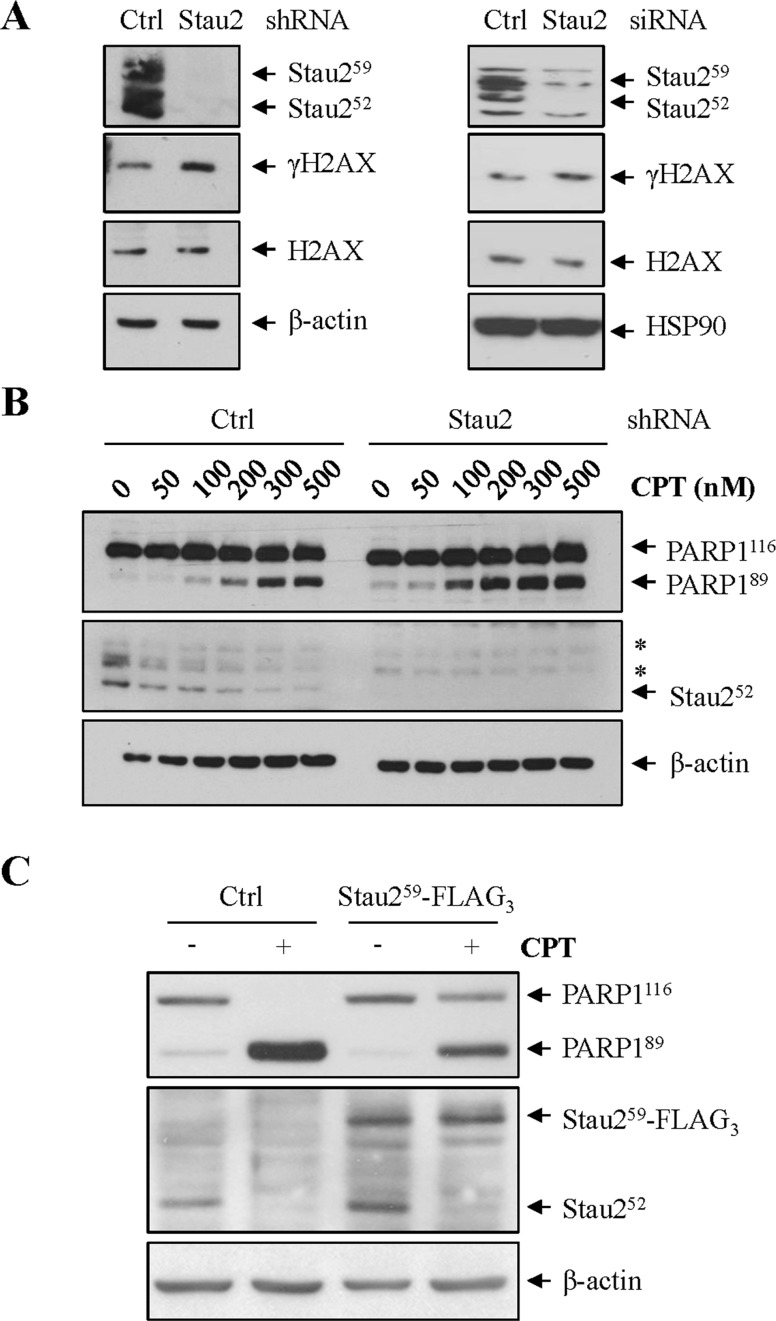
Staufen2 (Stau2) is an RNA-binding protein involved in cell fate decision by controlling several facets of mRNA processing including localization, splicing, translation and stability. Herein we report that exposure to DNA-damaging agents that generate replicative stress such as camptothecin (CPT), 5-fluoro-uracil (5FU) and ultraviolet radiation (UVC) causes downregulation of Stau2 in HCT116 colorectal cancer cells. In contrast, other agents such as doxorubicin and ionizing radiation had no effect on Stau2 expression. Consistently, Stau2 expression is regulated by the ataxia telangiectasia and Rad3-related (ATR) signaling pathway but not by the DNA-PK or ataxia telangiectasia mutated/checkpoint kinase 2 pathways. Stau2 downregulation is initiated at the level of transcription, independently of apoptosis induction. Promoter analysis identified a short 198 bp region which is necessary and sufficient for both basal and CPT-regulated Stau2 expression. The E2F1 transcription factor regulates Stau2 in untreated cells, an effect that is abolished by CPT treatment due to E2F1 displacement from the promoter. Strikingly, Stau2 downregulation enhances levels of DNA damage and promotes apoptosis in CPT-treated cells. Taken together our results suggest that Stau2 is an anti-apoptotic protein that could be involved in DNA replication and/or maintenance of genome integrity and that its expression is regulated by E2F1 via the ATR signaling pathway.


Figures

Figure 1.
Figure 1.
Decrease of Stau2 expression in response to camptothecin (CPT) treatment. (AC) HCT116 cells were treated for 24 h with increasing doses of CPT as indicated and cell extracts were analyzed by western blotting (A) and RT-qPCR (C). (B) Quantification of Stau252 protein and mRNA (all isoforms) levels and of PARP1 cleavage (PARP189/PARP1116) in the representative experiment. The western blot is representative of three independently preformed experiments. PARP1 cleavage was used as a measure of apoptosis and β-actin as a loading control. The RT-qPCR data represent the means and standard deviation of three independently performed experiments. The ratio of specific gene mRNAs on GAPDH mRNA in DMSO-treated cells (0 nM) was arbitrary fixed to 1. Stau1, Staufen 1 (an RNA-binding protein—paralog of Stau2); APAF1, apoptotic peptidase activating factor 1; GRP78, glucose-related protein 78. APAF1 mRNAs, known to be upregulated in apoptotic cells, was used as positive controls. GRP78 was used as a negative control. Statistical analyses (Student's t-test) are indicated when significant. ***P-value ≤ 0.001; **P-value ≤ 0.01; *P-value ≤ 0.05. (DF) HCT116 cells were incubated in constant amounts of CPT (300 nM) for increasing periods of time. Cells were lysed and Stau2 expression was analyzed by western blotting (D) and RT-qPCR (F). (E) Quantification of Stau2 protein and mRNA levels and of PARP1 cleavage (PARP189/PARP1116) over times in the representative experiment. The thin black lines represented the best fit on the curves. The western blot is representative of four independently performed experiments. Stau2 decline and PARP1 cleavage were normalized to their values at time 0. The RT-qPCR data represent the means and standard deviation of four independently performed experiments. The ratio of specific gene mRNAs on GAPDH mRNA at time 0 was arbitrary fixed to 1.
Figure 2.
Figure 2.
Stau2 is downregulated in response to other DNA damaging agents. (A and B) HCT116 cells were incubated in the presence of different DNA damaging agents for 24 h. DMSO, dimethyl sulfoxide (vehicle used as control); CPT (300 nM); 5FU, 5-fluoro-uracile (3 μM); Doxo, doxorubicin (6 μM). (CF) HCT116 cells were irradiated with different doses of UVC (C and D) or IR (E and F). Cells were collected at different time points post-treatment and cell extracts were analyzed by western blotting (A, C and E) and RT-qPCR (B,D and F). (A, C and E) The western blots are representative of three independently performed experiments. Induction of apoptosis was monitored by the cleavage of PARP1 and DNA damage by the presence of γH2AX. β-actin antibody was used as a loading control. Stau2 protein quantification is shown in (B) and in the Supplementary Figure S2. (B, D and F) Stau2 mRNA expression was normalized to that of GAPDH mRNA, the ratio in mocked-treated cells being fixed to 1. Data represent the means and standard deviation of three independently performed experiments. Statistical analyses (Student's t-test) are indicated when significant. ***P-value ≤ 0.001; **P-value ≤ 0.01; *P-value ≤ 0.05.
Figure 3.
Figure 3.
Signaling pathways involved in Stau2 downregulation. HCT116 cells were incubated in the presence of different kinase inhibitors for 4 h, then with the inhibitors and CPT (300 nM) (A) for another 4 h, or (B) incubated in the presence of different kinase inhibitors for 4 h, then irradiated at 10 J/m2 and re-incubated for 4 h in the presence of inhibitors. Stau2 protein expression was analyzed by western blotting while Stau2 mRNA levels were quantified by RT-qPCR. Stau2 expression was normalized to that of Hsp90 protein or GAPDH mRNA, the ratio in DMSO-treated cells without inhibitors being fixed to 1. Data represent the means and standard deviation of three independently performed experiments. Statistical analyses (Student's t-test) are indicated when significant. ***P-value ≤ 0.001; *P-value ≤ 0.05. DMSO, dimethyl sulfoxide; ATM (20 μM); ATR (20 μM); CHEK1 (20 μM); CHEK2 (20 μM); DNA-PK (10 μM).
Figure 4.
Figure 4.
Stau2-FLAG expressed from a viral promoter is not downregulated in response to CPT treatment. HCT116 cells were transfected with the empty vector (0) or with increasing concentrations of a plasmid coding for Stau259-FLAG3. Cells were then incubated in 300 nM CPT for 24 h. (A) Cells were lysed and Stau2 expression was analyzed by western blotting using anti-Stau2 and anti-FLAG antibodies. PARP1 cleavage was used as an indicator of apoptosis. Representative data of three independently performed experiments. (B) Quantification of endogenous Stau2 and of transfected Stau259-FLAG3. The ratio of Stau2 on β-actin in cells without CPT (−) was arbitrary fixed to 1. (C) mRNAs isolated from HCT116 cells (as in (A)) were quantified by RT-qPCR using oligonucleotides that only recognized Stau259-FLAG3 or that recognized both Stau2 endogenous and Stau259-FLAG3 (Stau2 all). Data represent the means and standard deviation of three independently performed experiments. The ratio of specific gene mRNAs on GAPDH mRNA in vector-transfected cells without CPT (−) was arbitrary fixed to 1. Statistical analyses (Student's t-test) are indicated when significant. ***P-value ≤ 0.001; **P-value ≤ 0.01; *P-value ≤ 0.05.
Figure 5.
Figure 5.
Identification of the endogenous Stau2 promoter. (A) Schematic representation of plasmids coding for the F-Luciferase gene (F-luc) under the control of different fragments isolated from the putative promoter region of the Stau2 gene. Arrows indicated the position of the transcription start site. (Δ), deletion. (B) HEK293T cells were transfected with plasmids coding for YFP and the promoter-less F-luc construct (Ctrl) or co-transfected with plasmids coding for F-luc as described in (A) and YFP (as a transfection normalization marker). Expression of F-luc and YFP was quantified and the ratio of luciferase activity on the YFP signal was calculated. The ratio from YFP-transfected cells was arbitrary fixed to 1. Data represent the means and standard deviation of three independently performed experiments. (C) HCT116 cells that expressed YFP (Ctrl) or YFP along with different F-luc constructs as indicated were incubated or not in 300 nM CPT for 24 h. Expression of F-luc and YFP was quantified and the ratio of luciferase activity on the YFP signal was calculated. The ratio from untreated cells (NT) was arbitrary fixed to 1. Data represent the means and standard deviation of three independently performed experiments. Statistical analyses (Student's t-test) are indicated when significant. **P-value ≤ 0.01; *P-value ≤ 0.05. (D) Sequence and schematic representation of the minimal 394 bp Stau2 promoter sequence. In the sequence, the position of the putative E2F1 binding site is underlined whereas nucleotides of the first exon are in italics. Schematic representation of the 198 nt of promoter sequence, with the position of the E2F1 binding site (star), the position of the transcription start site (arrow) and the 196 bp exon (E)/intron (I) region of the Stau2 gene. Restriction enzymes used to clone this fragment are indicated.
Figure 6.
Figure 6.
The transcription factor E2F1 upregulates Stau2 transcription. (A) E2F1 is fused to the estrogen receptor-binding domain tagged with HA (HA-ER). The ER-fusion protein is expressed in the cytosol and translocates to the nucleus in the presence of the ER ligand 4-hydroxytamoxifen (OHT). HCT116 cells were transfected with plasmids coding for HA-ER or HA-ER-E2F1 and incubated in the presence (+) or absence (−) of OHT (500 nM). Expression of the proteins was detected by western blotting. *: non-specific bands. (B) Expression of known (APAF1) and putative (Stau2) endogenous targets of E2F1 was analyzed by RT-qPCR and normalized on that of GAPDH mRNA. Expression in the absence of OHT and E2F1 (ER-OHT) was arbitrarily normalized to 1. Data represent the means and standard deviation of three independently performed experiments. (C) HA-ER- and HA-ER-E2F1-expressing HCT116 cells were co-transfected with plasmids coding for YFP and F-luc under the control of the minimal Stau2 promoter (pGL3 Stau2 -394) or without any promoter region (pGL3 control). Cells were then incubated in the absence or presence of OHT. A ratio of F-luc activity on YFP signal was calculated in each condition. The ratio in the absence of OHT was arbitrary fixed to 1. Data represent the means and standard deviation of three independently performed experiments. Statistical analyses (Student's t-test) are indicated when significant. **P-value ≤ 0.01.
Figure 7.
Figure 7.
Correlation between the E2F1-binding site in the Stau2 promoter and Stau2 expression. (A) Schematic representation of the mutated Stau2 promoters fused to F-luc. Star, putative E2F1-binding site; dot, point mutations; -198E, mutation in the E2F1-binding site; -198M, several mutations in the promoter but not in the E2F1-binding site; Arrow, transcription start site. (B) HCT116 cells were co-transfected with plasmids coding for YFP and F-luc under the control of a Stau2 promoter. Expression of F-luc and YFP was quantified and the ratio of luciferase activity on the YFP signal was calculated. The ratio from cells transfected with the control plasmid (Ctrl) was arbitrary fixed to 1. Data represent the means and standard deviation of three independently performed experiments. The dashed line indicates the level of expression of the control F-luc plasmid that has no promoter sequence. Statistical values are relative to the expression of the control plasmid. Statistical analyses (Student's t-test) are indicated when significant. *P-value ≤ 0.05; ***P-value ≤ 0.001. (C) Transfected HCT116 cells (as in B) were incubated in the absence (NT) or presence (CPT) of 300 nM CPT for 24 h. The ratio from untreated cells was arbitrary fixed to 1. Data represent the means and standard deviation of three independently performed experiments. ***P-value ≤ 0.001; **P-value ≤ 0.01; *P-value ≤ 0.05.
Figure 8.
Figure 8.
CPT displaces E2F1 from the Stau2 promoter. (A) HCT116 cells were transfected with plasmids coding for HA-ER or HA-ER-E2F1 as described in Figure 6A. Cells were further incubated in the absence or presence of CPT (300 nM) for 24 h. Expression of Stau2 mRNA and as control of APAF1 was analyzed by RT-qPCR and normalized on that of GAPDH mRNA. Expression in the absence of OHT, E2F1 (ER -OHT) and CPT was arbitrarily normalized to 1. Expression data represent the means and standard deviation of three independently performed experiments. Statistical analyses (Student's t-test) are indicated when significant. *P-value ≤ 0.05; **P-value ≤ 0.01. Note that similar profiles of APAF1 expression were observed in the three experiments although the levels of APAF1 induction varied from one experiment to the others. (B) ChIP assay. HA-ER-E2F1-expressing cells were incubated in the presence or absence of OHT (500 nM) for 24 h and then treated or not with CPT (300 nM) for 3 h. DNA was immunoprecipitated with anti-HA or anti-FLAG (as control) antibodies. Resulting DNA was qPCR-amplified with primers located in the Stau2 promoter as well as in the APAF1 promoter as positive control and HMBS as negative control. Ratios of the amount of immunoprecipitated DNA in the Stau2 or APAF1 promoters over that in the control region were calculated. Data represent the ratios of E2F1 occupancy in HA-ER-transfected cells over that in HA-ER-E2F1-transfected cells. Data represent the means and standard deviation of three independently performed experiments. *P-value ≤ 0.05.
Figure 9.
Figure 9.
Stau2 downregulation facilitates apoptosis and increases DNA damage. (A) HCT116 cells were either infected with viruses expressing a non-targeting shRNA (Ctrl) or a shRNA against Stau2. Cells were selected on puromycin for 48 h and then cell extracts were analyzed by western blotting for Stau2 expression, DNA damage (γH2AX) and loading (β-actin). Alternatively, cells were transfected with a non-targeting (Ctrl) or an siRNA against Stau2 and analyzed as above. (B) HCT116 cells were infected with a retrovirus expressing a non-targeting shRNA (Ctrl) or a shRNA against Stau2. Cells were selected on puromycin for 48 h and then treated or not with increasing concentrations of CPT for 24 h. Proteins were analyzed by western blotting as above. Quantification of PARP1 cleavage is shown in the Supplementary Figure S7. *, non-specific bands. (C) HCT116 cells were transfected with plasmids coding for the empty vector (Ctrl) or Stau259-FLAG3, selected on puromycin for 48 h and treated or not with CPT (300 nM) for 24 h. Cells extracts were prepared and analyzed by western blotting for apoptosis (PARP1 cleavage), Stau2 expression and loading (β-actin). In Stau259-FLAG3-expressing cells, a 5.8-fold reduction in PARP1 cleavage (PARP189/PARP1116) was observed as compared to vector-transfected cells.

Similar articles

Cited by

References

    1. Roos W.P., Kaina B. DNA damage-induced cell death: from specific DNA lesions to the DNA damage response and apoptosis. Cancer Lett. 2013;332:237–248. - PubMed
    1. Ciccia A., Elledge S.J. The DNA damage response: making it safe to play with knives. Mol. Cell. 2010;40:179–204. - PMC - PubMed
    1. Reinhardt H.C., Schumacher B. The p53 network: cellular and systemic DNA damage responses in aging and cancer. Trends Genet. 2012;28:128–136. - PMC - PubMed
    1. Medema R.H., Macurek L. Checkpoint control and cancer. Oncogene. 2012;31:2601–2613. - PubMed
    1. Aziz K., Nowsheen S., Pantelias G., Iliakis G., Gorgoulis V.G., Georgakilas A.G. Targeting DNA damage and repair: embracing the pharmacological era for successful cancer therapy. Pharmacol. Ther. 2012;133:334–350. - PubMed

Publication types

MeSH terms

Grants and funding