. 2016 Apr 20;44(7):3351-63.
doi: 10.1093/nar/gkw065. Epub 2016 Feb 3.

RNA cleavage products generated by antisense oligonucleotides and siRNAs are processed by the RNA surveillance machinery

Affiliations

RNA cleavage products generated by antisense oligonucleotides and siRNAs are processed by the RNA surveillance machinery

Walt F Lima et al. Nucleic Acids Res. .

Abstract

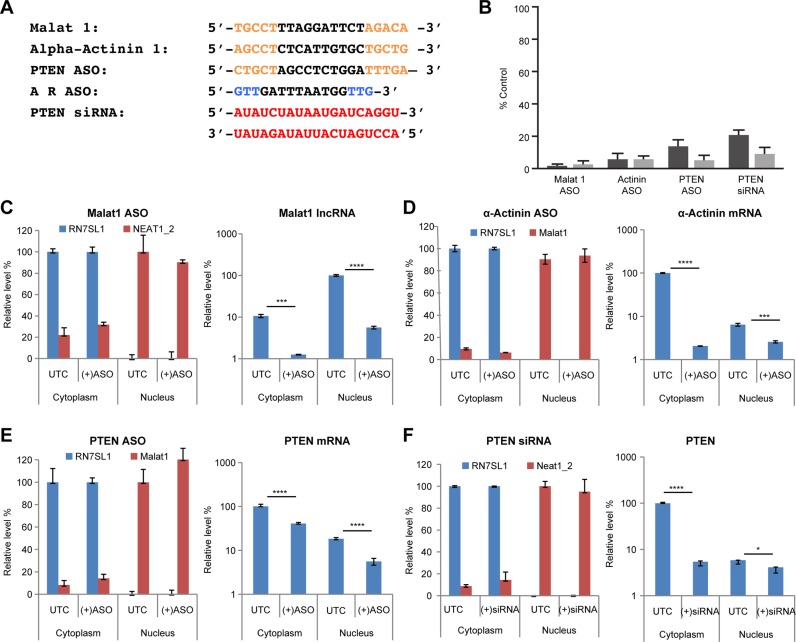
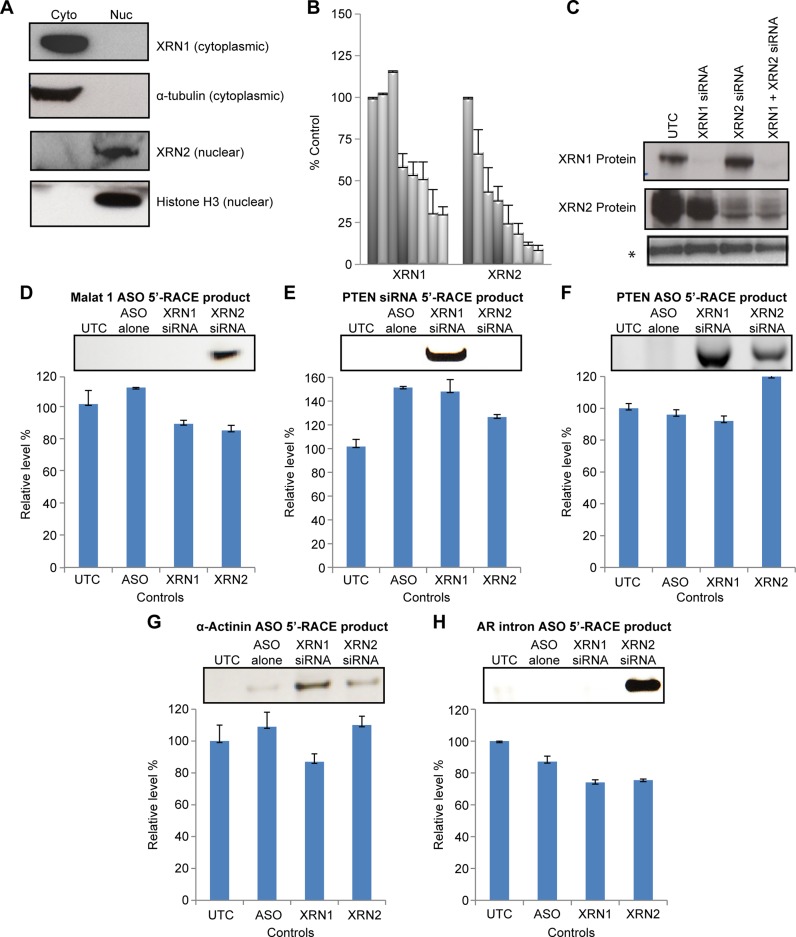
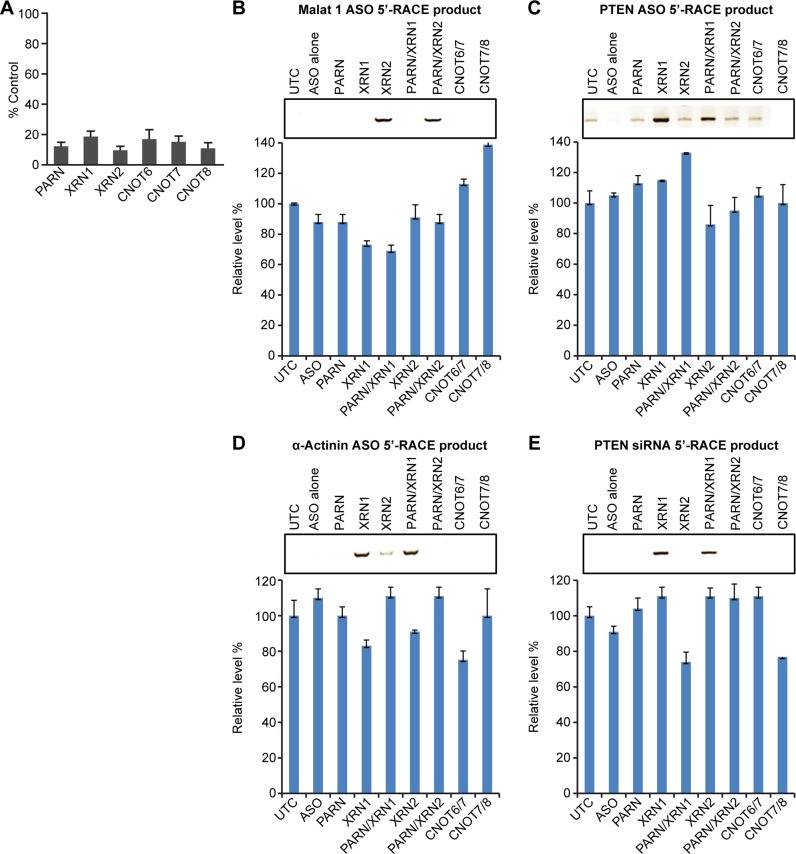
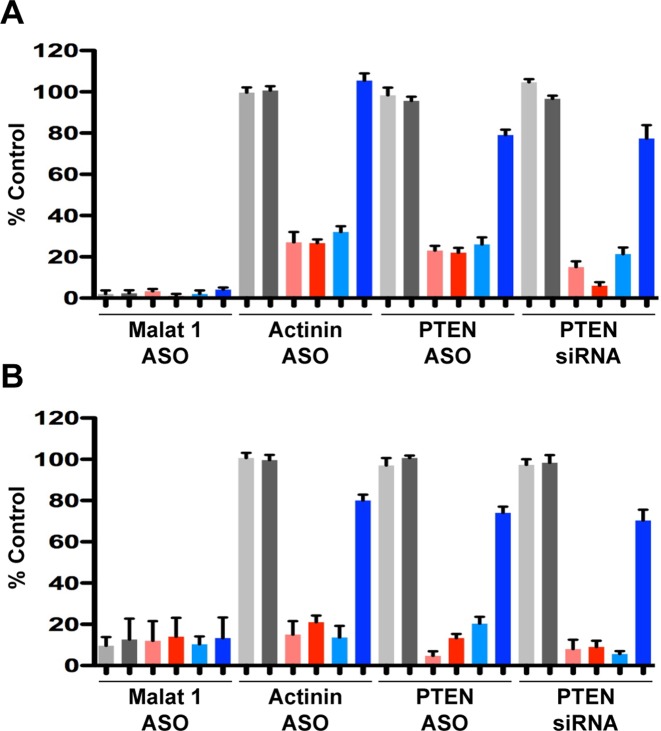
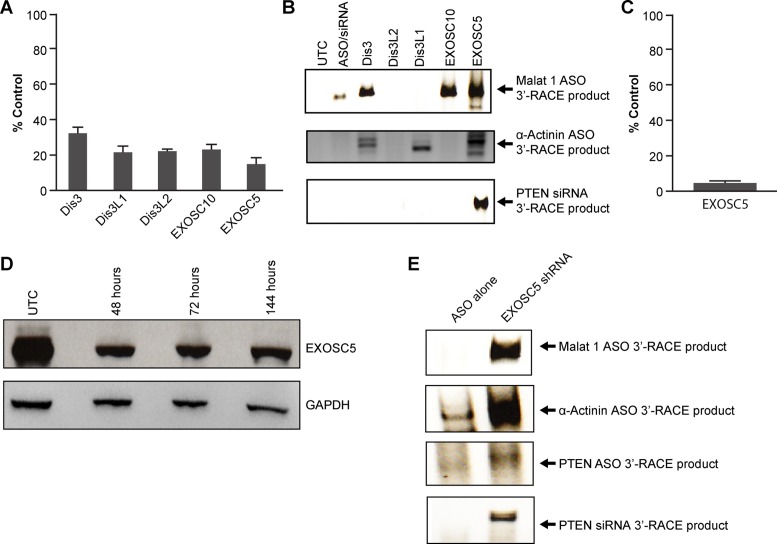
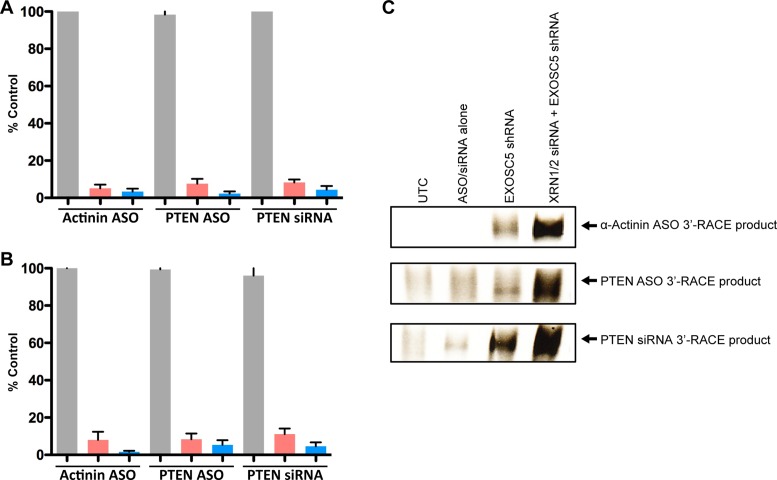
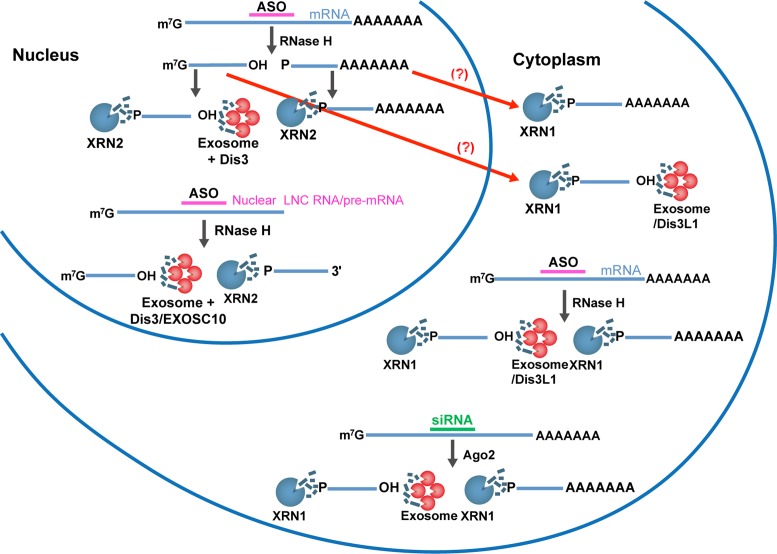
DNA-based antisense oligonucleotides (ASOs) elicit cleavage of the targeted RNA by the endoribonuclease RNase H1, whereas siRNAs mediate cleavage through the RNAi pathway. To determine the fates of the cleaved RNA in cells, we lowered the levels of the factors involved in RNA surveillance prior to treating cells with ASOs or siRNA and analyzed cleavage products by RACE. The cytoplasmic 5' to 3' exoribonuclease XRN1 was responsible for the degradation of the downstream cleavage products generated by ASOs or siRNA targeting mRNAs. In contrast, downstream cleavage products generated by ASOs targeting nuclear long non-coding RNA Malat 1 and pre-mRNA were degraded by nuclear XRN2. The downstream cleavage products did not appear to be degraded in the 3' to 5' direction as the majority of these products contained intact poly(A) tails and were bound by the poly(A) binding protein. The upstream cleavage products of Malat1 were degraded in the 3' to 5' direction by the exosome complex containing the nuclear exoribonuclease Dis3. The exosome complex containing Dis3 or cytoplasmic Dis3L1 degraded mRNA upstream cleavage products, which were not bound by the 5'-cap binding complex and, consequently, were susceptible to degradation in the 5' to 3' direction by the XRN exoribonucleases.


Figures

Figure 1.
Figure 1.
ASO- or siRNA-mediated reduction of target RNA and subcellular localization of targeted RNAs. (A) In sequences of the ASOs and siRNA, the orange, blue, red and black letters represent, respectively, 2′-methoxyethylribonucleotides, 2′-constrained ethylribonucleotides, 2′-ribonucleotides and 2′-deoxyribonucleotides. The siRNA was prepared by annealing the guide strand (top sequence) with complementary length matched RNA (bottom sequence). ASOs had phosphorothioate linkages; linkages in the siRNA were phosphodiester. (B) Target RNA levels were determined 24 h post ASO or siRNA treatment by RT-qPCR and are shown as a percentage of untreated controls. Dark and light gray bars correspond to, respectively, the upstream and downstream target RNA cleavage products. (CF) Cells treated with ASOs targeting Malat1 (C), α-Actinin (D), PTEN (E) or with a siRNA targeting PTEN (F) were collected and cytoplasmic and nuclear fractions were separated. The purity of the nuclear and cytoplasmic fractions (left panels) was determined by RT-qPCR using primers targeting, respectively, the cytoplasmic RNA RN7SL1 and nuclear NEAT1 or Malat1 RNA. The levels of the RN7SL1 RNA are shown as a percentage of the level in the cytoplasmic fraction in control cells; whereas the levels of NEAT1 or Malat1 RNA are shown as a percentage of the level in the nuclear fraction in control cells. RT-qPCR analyses of the target RNA downstream cleavage products were performed on the cytoplasmic and nuclear fractions from control cells treated with transfection reagent only (UTC) or ASO/siRNA treated cells (right panels, Y-axis is shown as logarithmic scale). The qPCR primers are located downstream to the cleavage sites on the target RNAs. The PPS used for the RT-qPCR are listed in Supplementary Figure S1A. The predicted sizes (base pairs) of the PCR products are: Malat1 495; α-Actinin 432; PTEN ASO 435; PTEN siRNA 435. The error bars represent standard deviation from three independent experiments. Statistics analysis was performed using unpaired t-test. *, P < 0.05; **, P < 0.01; ***, P < 0.001; ****, P < 0.0001.
Figure 2.
Figure 2.
XRN exonucleases degrade downstream RNA cleavage products. (A) Subcellular localization of XRNs was determined western blots performed on cytoplasmic (Cyto) and nuclear (Nuc) fractions of HeLa cells. Purity of the fractions was determined using antibodies to histone H3 and α-tubulin. (B) siRNA-mediated reduction of XRN mRNAs were quantified 48 h post treatment. Cells were transfected with 3-fold serial dilutions of the siRNAs ranging in concentration from 14 pM to 10 nM. The mRNA levels were determined by RT-qPCR and are shown as percentages of control cells (UTC) treated with transfection reagent only. The mean and standard errors reported are based on three trials. The PPS used for the RT-qPCR are listed in Supplementary Figure S1A. Note that the XRN1 siRNA had no effect on XRN2 or vice versa. (C) Western blot analyses of XRN proteins from untreated (UTC) and siRNA-treated cells 48 h post siRNA treatment. A non-specific band (*) serves as a control for loading. (DH) Cells were either treated or not with siRNA targeting XRN1 or XRN2 mRNA for 4 h, or were treated with transfection reagent only (UTC). Cells were then treated with Malat1 ASO (panel D), PTEN siRNA (Panel E), PTEN ASO (Panel F), α-Actinin ASO (Panel G) or AR ASO (Panel H), and 5′-RACE was performed 48 h later to detect downstream cleavage products. The adapter and primers used for the 5′-RACE are listed in Supplementary Figure S1B. RN7SL1 RNA was detected by RT-qPCR from 10% of input RNA for RACE and used as loading controls, as listed below each panel of the 5′ RACE results. The error bars represent standard deviation from three independent experiments. The predicted sizes (base pairs) of the 5′-RACE products are: Malat 1 504; α-Actinin 470; PTEN ASO 331; PTEN siRNA 266.
Figure 3.
Figure 3.
Deadenylases do not contribute significantly to degradation of downstream RNA cleavage products. (A) Cellular levels of XRN1, XRN2, and indicated deadenylase mRNAs 48 h post siRNA treatment. The mRNA levels were determined by RT-qPCR and are shown as a percentage of untreated control. The mean and standard errors reported are based on three trials. The PPS used for the RT-qPCR are listed in Supplementary Figure S1A. (BE) Cells were treated with individual or combined XRN or deadenylase siRNAs. After 4 h, cells were treated with Malat1 ASO (Panel B), PTEN ASO (Panel C), α-Actinin ASO (Panel D) or PTEN siRNA (Panel E). 5′-RACE of the RNA downstream cleavage products was performed after 48 h. RN7SL1 RNA was detected by RT-qPCR from 10% of input RNA for RACE and used as loading controls, as shown below each panel of the RACE products. The error bars represent standard deviation from three independent experiments. The adapter and primers used for the 5′-RACE are listed in Supplementary Figure S1B.
Figure 4.
Figure 4.
Downstream target RNA cleavage products are polyadenylated and bound to PABPC1. (A) Poly(A) RNA was isolated from control cells treated with transfection reagent alone (gray bars), cells treated with target ASOs or siRNA alone (red bars), or from cells treated with both target ASOs/siRNA and XRN1 and XRN2 siRNAs (blue bars). (B) Levels of the target RNA cleavage products associated with immunoprecipitated PABPC1 from untreated cells (gray bars), cells treated with target ASOs or siRNA alone (red bars) or cells treated with both target ASOs/siRNA and XRN1 and XRN2 siRNAs (blue bars). Levels of the target RNA cleavage products were determined 48 h post treatment by RT-qPCR and are shown as a percentage of untreated controls. The mean and standard errors reported are based on three trials. Light and dark hues bars represent, respectively, the target RNA upstream and downstream cleavage products. The PPS used for the RT-qPCR are listed in Supplementary Figure S1A.
Figure 5.
Figure 5.
Exosome complex degrades upstream cleavage products. (A) Cellular levels of indicated mRNAs 48 h post siRNA treatment. The mRNA levels were determined by RT-qPCR and are shown as a percentage of untreated controls. The mean and standard errors reported are based on three trials. (B) 3′-RACE of the target RNA upstream cleavage products from ASO or siRNA treated and control cells (UTC) treated with transfection reagent only. 3′-RACE was performed 48 h post treatment with Malat 1, α-Actinin or PTEN ASOs or siRNA alone or with both target-specific ASO/siRNA and exosome/exonuclease siRNAs. The predicted sizes of the 3′-RACE products are: Malat1 378; α-Actinin 423; PTEN ASO 439; PTEN siRNA 386. (C) Cellular level of EXOSC5 mRNA 48 h post shRNA treatment. (D) Western blot analysis of EXOSC5 protein from untreated (UTC) and siRNA treated cells 48 h to 144 h post siRNA treatment. (E) 3′-RACE of upstream cleavage products was performed on extracts of cells treated with Malat1, α-Actinin, or PTEN ASOs or siRNA alone or first treated 144 h with EXOSC5 shRNA and then with target-specific ASO/siRNA. The PPS used for the RT-qPCR are listed in Supplementary Figure S1A. The adapter and primers used for the 3′-RACE are listed in Supplementary Figure S1C.
Figure 6.
Figure 6.
Upstream cleavage products are not bound by PABPC1 or eIF4E and are degraded by both XRNs and the exosome complex. (A and B) Levels of the target RNA upstream cleavage products associated with (A) PABPC1 or (B) eIF4E from untreated cells (gray bars), cells treated with target ASOs or siRNA alone (red bars), or cells treated first with XRN siRNAs and EXOSC5 shRNA and then with ASO or siRNA (blue bars). Levels of the target RNA cleavage products were determined 48 h post treatment by RT-qPCR and are shown as a percentage of their respective untreated controls (transfection reagent only). (C) Cells were treated with EXOSC5 shRNA or XRN siRNAs and EXOSC5 shRNA and then with ASO or siRNA. 3′-RACE of the target RNA upstream cleavage products was performed 48 h post treatment. The PPS used for the RT-qPCR are listed in Supplementary Figure S1A. The adapter and primers used for the 3′-RACE are listed in Supplementary Figure S1C.
Figure 7.
Figure 7.
Degradation pathway for RNA cleavage products generated by treatment with ASO or siRNA. In the nucleus, XRN2 and either the exosome containing Dis3 and /or EXOSC10 degrades the nuclear-retained target RNA upstream cleavage products and XRN2 degrade the downstream cleavage products. The same pathway may also be involved in the degradation of mRNA cleavage products generated by ASOs in the nucleus and/or these cleavage products may be exported to the cytoplasm for processing by XRN1, the exosome and/or Dis3L1. In the cytoplasm, mRNA cleavage products resulting from treatment with ASOs or siRNAs are degraded by XRN1, the exosome and/or Dis3L1.

References

    1. Badis G., Saveanu C., Fromont-Racine M., Jacquier A. Targeted mRNA degradation by deadenylation-independent decapping. Mol. Cell. 2004;15:5–15. - PubMed
    1. Conti E., Izaurralde E. Nonsense-mediated mRNA decay: molecular insights and mechanistic variations across species. Curr. Opin. Cell Boil. 2005;17:316–325. - PubMed
    1. Parker R., Song H. The enzymes and control of eukaryotic mRNA turnover. Nat. Struct. Mol. Biol. 2004;11:121–127. - PubMed
    1. Garneau N.L., Wilusz J., Wilusz C.J. The highways and byways of mRNA decay. Nat. Rev. Mol. Cell. Biol. 2007;8:113–126. - PubMed
    1. Goldstrohm A.C., Wickens M. Multifunctional deadenylase complexes diversify mRNA control. Nat. Rev. Mol. Cell. Biol. 2008;9:337–344. - PubMed

Publication types

MeSH terms