. 2016 Feb 4:7:10584.
doi: 10.1038/ncomms10584.

GABAergic interneurons form transient layer-specific circuits in early postnatal neocortex

Affiliations

GABAergic interneurons form transient layer-specific circuits in early postnatal neocortex

Paul G Anastasiades et al. Nat Commun. .

Abstract

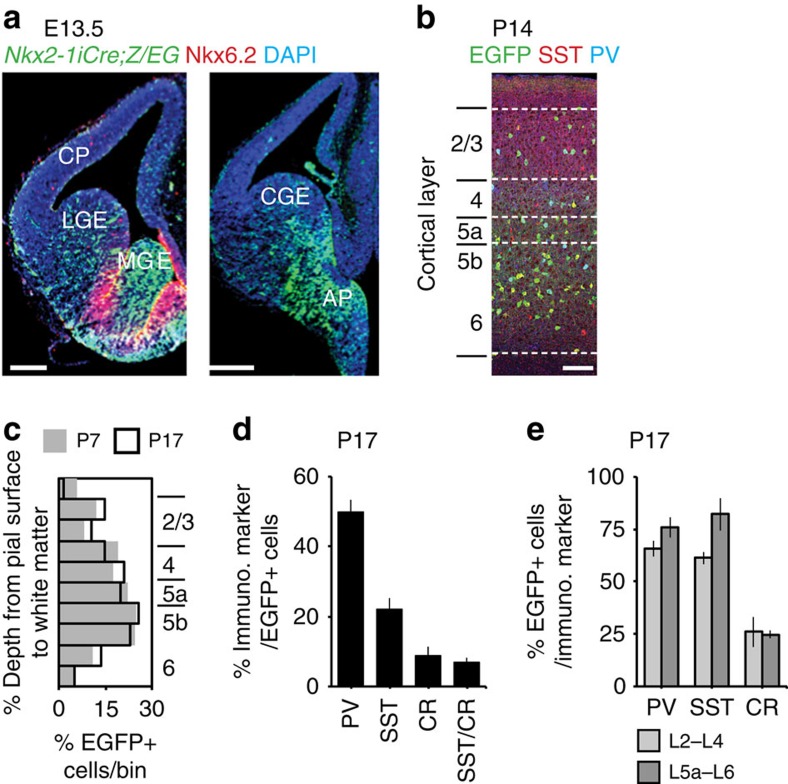
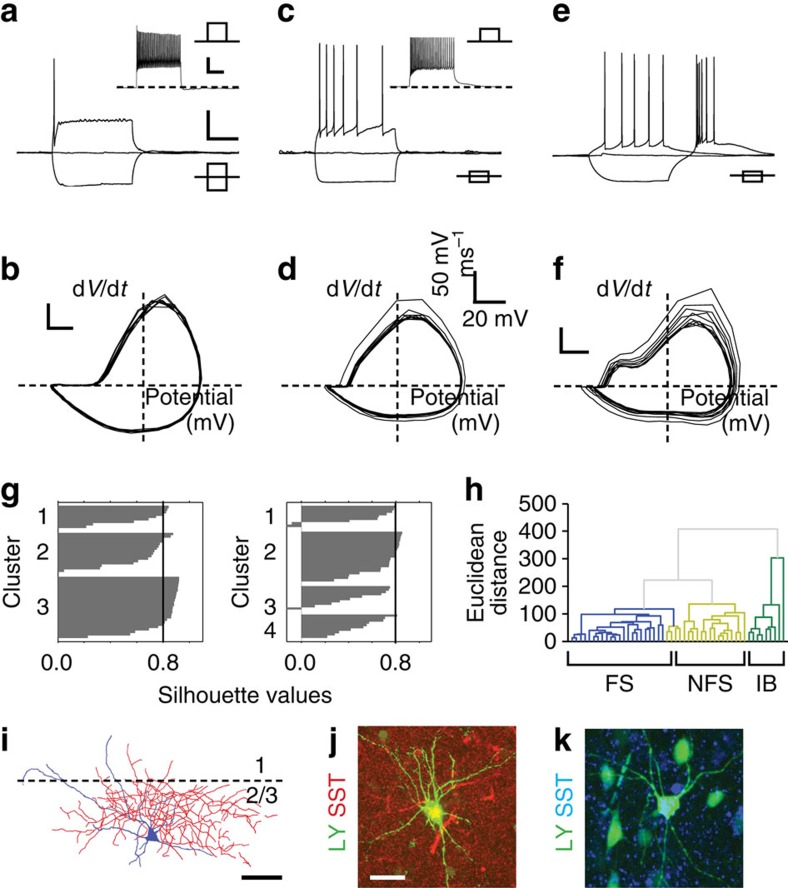
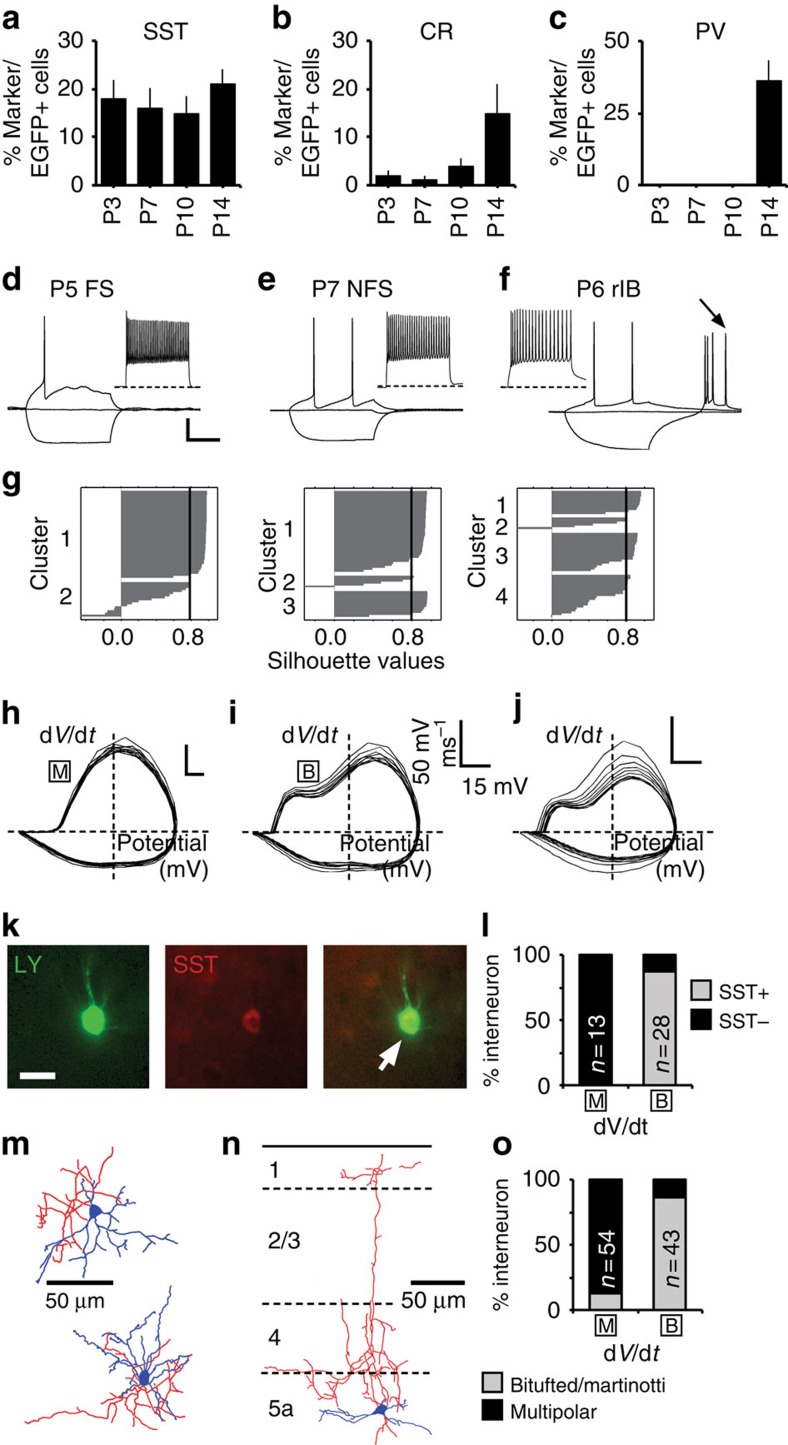
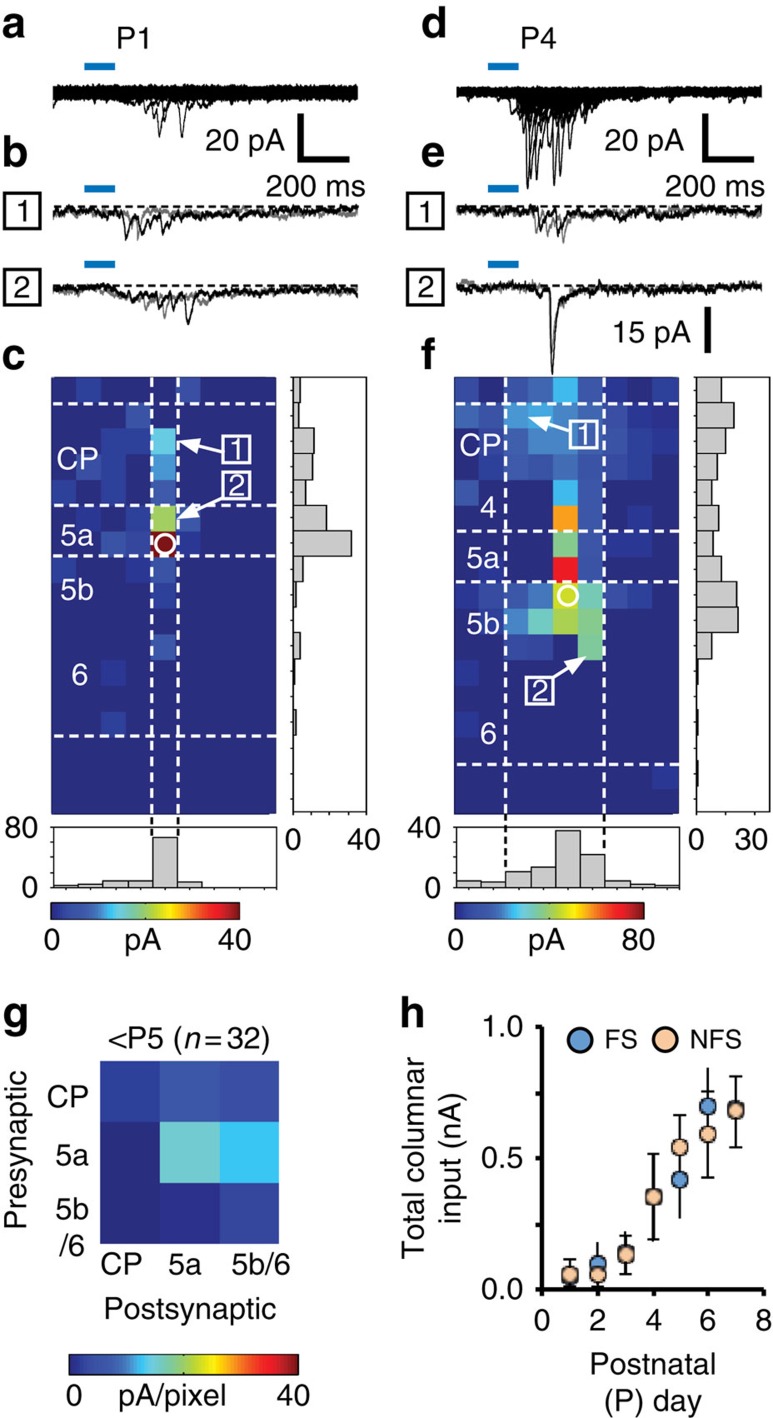
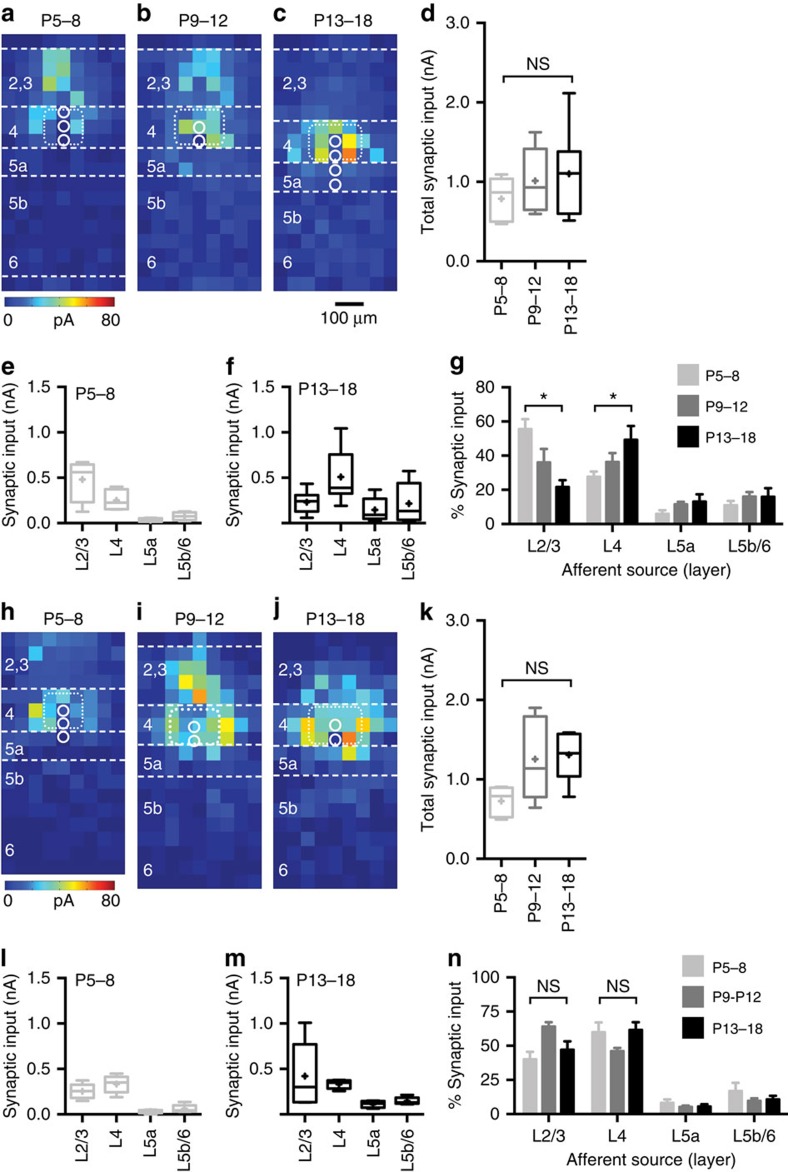
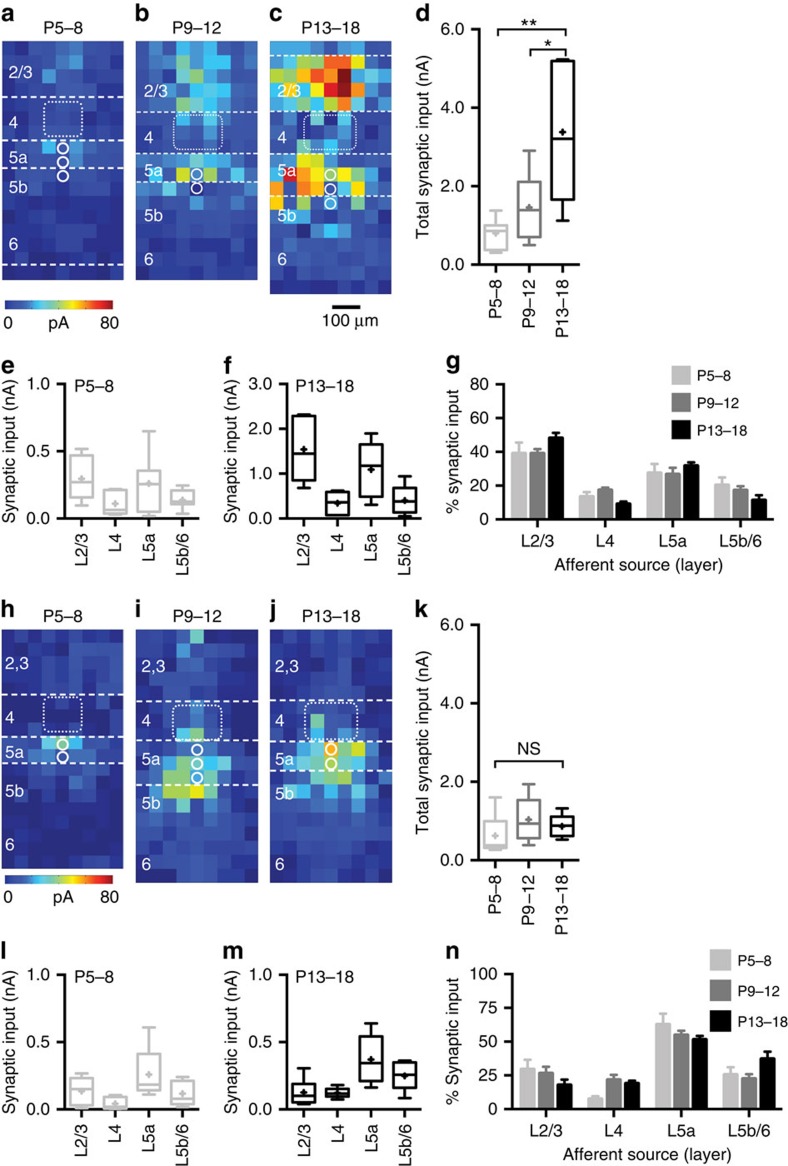
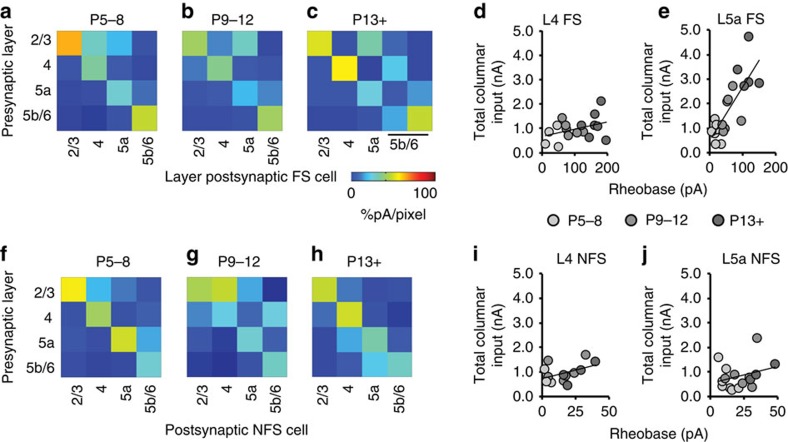
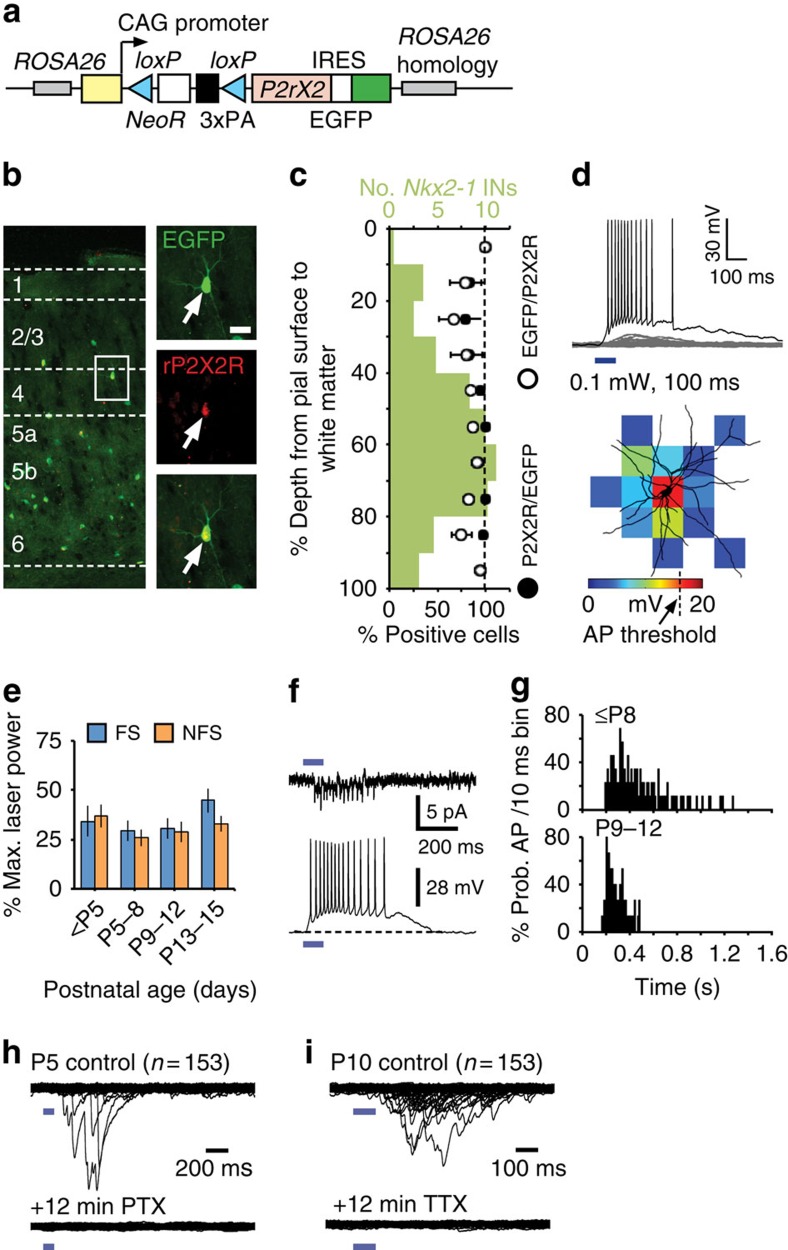
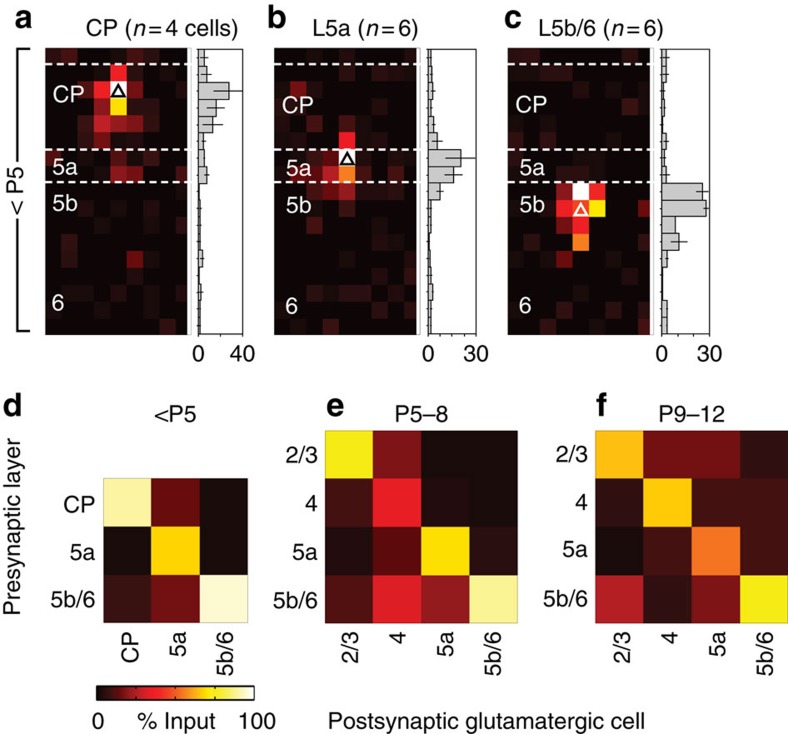
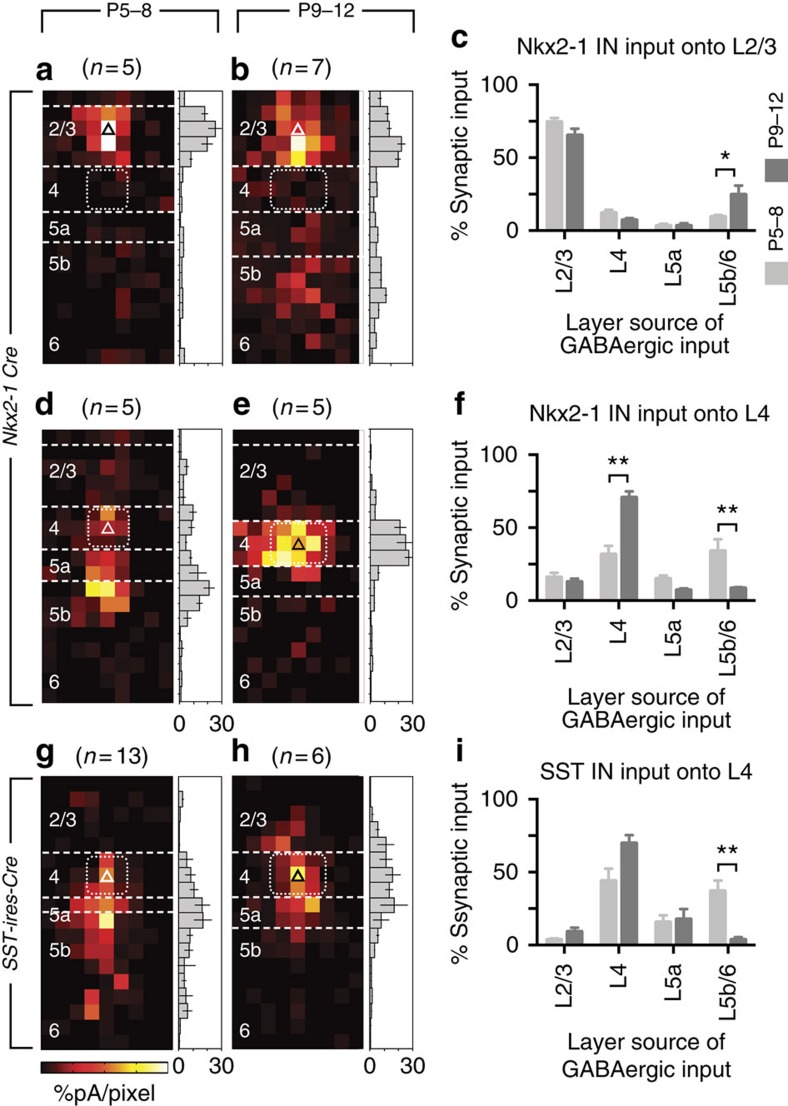
GABAergic interneurons play key roles in cortical circuits, yet little is known about their early connectivity. Here we use glutamate uncaging and a novel optogenetic strategy to track changes in the afferent and efferent synaptic connections of developing neocortical interneuron subtypes. We find that Nkx2-1-derived interneurons possess functional synaptic connections before emerging pyramidal cell networks. Subsequent interneuron circuit maturation is both subtype and layer dependent. Glutamatergic input onto fast spiking (FS), but not somatostatin-positive, non-FS interneurons increases over development. Interneurons of both subtype located in layers (L) 4 and 5b engage in transient circuits that disappear after the somatosensory critical period. These include a pathway mediated by L5b somatostatin-positive interneurons that specifically targets L4 during the first postnatal week. The innervation patterns of immature cortical interneuron circuits are thus neither static nor progressively strengthened but follow a layer-specific choreography of transient connections that differ from those of the adult brain.


Figures

Figure 1
Figure 1. Origin and identity of early postnatal Nkx2-1 neocortical interneurons.
(a) EGFP expression in rostral (left) and more caudal (right) aspect of the embryonic (E)13.5 telencephalon. There was an absence of EGFP in Nkx6.2-expressing progenitors (red) bordering the sulcal region between the MGE and lateral ganglionic eminence. AP, anterior entopeduncular area; CP, cortical plate; MZ, marginal zone; WM, white matter tract. Scale bar, 100 μm. (b) Distribution of EGFP+ cells across the depth of the whisker barrel cortex at P14. (c) Comparison of the distribution of Nkx2-1-derived interneurons at early (P7) and more mature (P17) ages (data sampled from n≥4 brains). (d) Percentage of EGFP+ cells expressing parvalbumin (PV; sampled from n=5 brains), somatostatin (SST; n=5), calretinin (CR; n=7) or both SST and CR (SST/CR; n=5) measured across the depth of an arbitrary 250 μm column in S1BF at P17. (e) Percentage of cells expressing any given marker that also expressed EGFP at P17, split according to superficial (layers (L)2–4) and deep (L5a–6) layers. All data in d,e are mean±s.e.m.
Figure 2
Figure 2. Electrophysiological profile of mature Nkx2-1 neocortical interneuron subtypes.
Intrinsic electrophysiology profiles of the three observed Nkx2-1 interneuron subtypes: (a,b) fast spiking (FS), (c,d) non-fast spiking (NFS) and (e,f) rebound intrinsic bursting (rIB) interneuron. Scale bar (shown in a): 200 ms, 25 mV (a,c,e) Threshold spike, resting membrane potential and response to hyperpolarising current injection for the various subtypes; note the burst of two or more action potentials observed in response to release of hyperpolarising current injection in the rIB interneuron (e). Inset: corresponding near maximal firing frequency response for the (a) FS, and (c) NFS cells; rIB interneurons showed adaptation in spike frequency similar to the (c) NFS subtype. (b,d,f) Phase plot (dV/dt versus voltage) for the cells shown in a, c and e, observed in response to suprathreshold current injection sufficient to elicit 10 spikes (20 Hz). (g) Silhouette plot derived from k-means (Matlab R2014a) cluster analysis with k (the number of clusters) set at 3 (left) and 4 (right plot); larger silhouette values closer to 1 are indicative of a compact cluster distinct from other clusters. (h) Dendrogram of hierarchical unsupervised clustering based on nine electrophysiological variables measured in 50 Nkx2-1 interneurons. The x axis represents individual cells and the y axis Euclidean distance. FS cells are shown in blue, NFS and rIB in light and dark green, respectively. (i) Dense multipolar arbour of the P16 FS cell shown in a,b; scale bar, 28 μm. (j,k) Somatostatin expression in recovered lucifer yellow (LY)-filled NFS (j) and rIB (k) interneuron; LY-filled neurons (arrows) were distinguished from other Nkx2-1 interneuron GFP+ profiles by their extensive dendritic and axon fills. Scale bar, 15 μm.
Figure 3
Figure 3. Identification of Nkx2-1 interneuron subtypes through early postnatal development.
(a) Percentage of Nkx2-1Cre;Z/EG EGFP+ cells expressing somatostatin (SST) across the depth of a 250-μm width column of S1BF neocortex at four time points through early development; corresponding data for (b) calretinin (CR) and (c) parvalbumin (PV; data obtained from n≥4 brains). Responses to threshold and hyperpolarizing current injection of d P5 fast spiking (FS) interneuron; (e) P7 non-fast spiking (NFS) interneuron; (f) P6 rebound intrinsic spiking interneuron (rIB), arrow, burst of action potentials observed following release from hyperpolarizing current injection; scale bar, 20 mV, 200 ms. Inset: near maximal firing frequency recordings for the corresponding cells. (g) Silhouette plot derived from k-means cluster analysis with k (the number of clusters) set at 2 (left), 3 (middle) and 4 (right plot). (hj) Phase plot (dV/dt versus voltage) for the same cells as df observed in response to suprathreshold current injection sufficient to elicit 10 spikes (20 Hz). [B], biphasic rising phase; [M], monophasic rising phase. (k) SST expression (arrow) in the recovered Lucifer yellow (LY)-filled soma of the neuron shown in e (scale bar, 12 μm). (l) Relationship between phase plot profile (x axis; M, monophasic, B, biphasic) and expression of SST in recorded immature interneurons. (m,n) Reconstructed morphologies of early Nkx2-1 interneurons with characteristic multipolar, local arbor, SST-negative, immature FS interneurons. (n) Distinctive ascending axon of a SST-expressing immature NFS interneuron. Approximate layer boundaries indicated by the dashed lines. (o) Histogram showing the percentage of cells assigned to a given phase plot profile (x axis) that were classified as either bitufted dendritic morphology (grey bar), often with an ascending axons (Martinotti), or multipolar dendrites (black; typically ≥4 primary dendrites).
Figure 4
Figure 4. Early onset of glutamatergic afferent input onto Nkx2-1 interneurons.
(a) Superimposed voltage clamp sweeps showing the total observed postsynaptic responses recorded onto a P1 immature FS interneuron during LSPS mapping of glutamatergic afferent input across a 153 (9 × 17) spot grid spanning the depth of the neocortex; laser pulse duration indicated by the blue line. (b) Superimposed postsynaptic responses observed after repeat photostimulation at the two laser target spots indicated on the average map (c). (c) Map of synaptic responses (average of n=4 maps) for the immature L5a FS cells (position indicated by the open white circle) shown in a,b. Grey histogram plots show the normalized glutamatergic afferent input across the horizontal (columnar) and vertical (laminar) axes. Horizontal dashed white lines indicate layer boundaries to the nearest 50 μm. Vertical dashed white lines indicate the region of interest (ROI) for subsequent data analysis. (df) Corresponding data for a P4 border L5a/5b NFS interneurons: (d) total observed postsynaptic responses recorded across the 153 spot LSPS grid, (e) example postsynaptic responses including occasional large (>15 pA) EPSCs and (f) map of afferent input onto the NFS interneuron (average of n=5 maps). (g) Connectivity matrix showing the glutamatergic afferent input onto P1–4 Nkx2-1 interneurons. (h) The total columnar (ROI) glutamatergic input onto immature FS (blue circles) and NFS (orange) interneurons over the first postnatal week; all values mean±s.e.m.
Figure 5
Figure 5. Development of glutamatergic afferent input onto L4 Nkx2-1 interneuron subtypes.
(ac) The source of glutamatergic afferent input onto layer 4 (L4) motif FS interneurons collapses into the immediate barrel (average barrel location indicated by the dotted white line) over development (P5–8: n=5 cells; P9–12: n=6; P13+: n=7). The location of the FS interneurons averaged for each map are represented with the open white circles—please note that a single circle on the average map can represent multiple cells recorded at the same corresponding location; horizontal dashed white lines indicate layer boundaries to the nearest 50 μm. (d) Total glutamatergic afferent input onto L4 FS cells through early development. Boxplot: cross, mean; horizontal line, median; box, s.d.; error bars, spread of the data; NS, no significant difference between age groups. (e,f) Breakdown of total input onto L4 FS cells by layer at early (P5–8) and late (P13–18) time points; format of the boxplot as in d. (g) Percentage afferent input from each layer onto L4 FS interneurons over development; error bars, s.e.m., asterisk, L2/3: P=0.004, Kruskal–Wallis test (Dunn correction for multiple comparisons); L4: P=0.030 Kruskal–Wallis test (Dunn correction). (hn) Corresponding data for L4 NFS interneurons (P5–8: n=4 cells; P9–12: n=5; P13+: n=5).
Figure 6
Figure 6. Development of glutamatergic afferent input onto L5a Nkx2-1 interneuron subtypes.
(ac) Static motif observed in L5a FS interneurons that underwent little change in the distribution of the source of their afferent glutamatergic input over development. (a) P5–8: n=7 cells; (b) P9–12: n=6; (c) P13+: n=5. (d) Total glutamatergic afferent input onto L5a FS cells through early development. Boxplot: cross, mean; horizontal line, median; box, s.d.; error bars, spread of the data; **P=0.005, Mann–Whitney U=1; *P=0.045, Mann–Whitney U=6). (e,f) Breakdown of total input onto L5a FS cells by layer at early (P5–8) and late (P13–18) time points; format of the boxplot as in d. (g) Percentage afferent input from each layer onto L5a FS interneurons over development. (hn) Corresponding data for L5a NFS interneurons (P5–8: n=6 cells; P9–12: n=4; P13+: n=4); NS, no significant difference between age groups.
Figure 7
Figure 7. Organization of glutamatergic afferent input onto Nkx2-1 interneurons across the depth of the cortex and the relationship between intrinsic maturation and PYR network integration in developing Nkx2-1 interneuron subtypes.
Connectivity matrices for developing FS interneurons recorded across the depth of S1BF divided according to age: (a) P5–8, (b) P9–12 and (c) P13+. To enable comparison across ages groups, data shown in ac are normalized (%pA/pixel). At P13+, an additional L5b/6 motif with prominent afferent input from layer 4 (L4) was observed. (d,e) Plot of rheobase versus total columnar afferent input for interneurons recorded over development. (d) L4 FS interneurons showed little relationship between intrinsic excitability (rheobase) and total columnar input (R2=0.14), whereas this was more prominent in L5a FS cells (R2=0.62). (fh) Connectivity matrices (%pA/pixel) for immature NFS interneurons recorded across the depth of S1BF; (f) P5–8, (g) P9–12 and (h) P13+. Little relationship was observed between intrinsic properties and network integration either (i) L4 (R2=0.20) or (j) L5a (R2=0.08) NFS interneurons.
Figure 8
Figure 8. Cell-specific LSPS using conditional expression of the rat ionotropic P2X2 purinergic receptor.
(a) R26::P2X2 allele construct. Grey boxes, Rosa26 homology sequences; yellow, CAG hybrid promoter; blue triangles, loxP sites; red, open-reading frame; white, selection marker. (b) Conditional expression of the rat P2X2 receptor (rP2X2R) in Nkx2-1 interneurons. Inset top: an EGFP+ cell (arrow) showing expression of rP2X2R (middle); inset bottom: combined image; scale bar, 15 μm. (c) Distribution of EGFP+ cells across the depth of the cortex (green histogram bars) with corresponding percentage of EGFP+/P2X2R+ (white circles) and P2X2R+/EGFP+ (black circles). (n=631 cells; n=5 brains, P7–8). (d) Laser intensity was adjusted to give focal ATP uncaging an effective resolution of 50 μm. Top panel: recording across our standard LSPS grid (n=153 laser target spots) with only one suprathreshold response (black trace) observed when firing the laser directly at the recorded interneuron soma; blue line, ultraviolet laser. Bottom panel: the dendritic morphology of the same cell superimposed with observed depolarisation colour coded according to the scale bar shown below. (e) The average laser power necessary to evoke a consistent, focal presynaptic response over the period of early development studied; Student's t-test P13–15, FS versus NFS P=0.264, t(10)=1.1828). (f) Direct suprathreshold responses recorded in cell-attached (top trace) and whole-cell patch-clamp (bottom trace) configuration (n=5 cells). (g) The average time course of ATP-evoked presynaptic APs in response to calibrated ultraviolet laser pulses at early (top graph; n=7 cells) and late (bottom; n=6) ages. (h) Top trace: synaptic currents recorded across the extent of the LSPS grid in a P5 PYR neuron in the presence of glutamatergic antagonists CNQX and AP-5 (both 30 μM); bottom trace: GABAA receptor antagonist picrotoxin (50 μM) abolished laser-evoked PSCs. (i) Postsynaptic currents in a P10 PYR cell were abolished following incubation with 1 μm TTX (bottom trace).
Figure 9
Figure 9. Efferent targets of Nkx2-1 interneurons are predominantly local in developing S1BF.
LSPS mapping of input arising from Nkx2-1 interneurons onto (a) cortical plate (CP), (b) L5a and (c) L5b/6 pyramidal cells (average position represented by the triangles); scale bar: <P5, 0–16% pA/pixel. (df) Connectivity matrices for Nkx2-1 interneuron efferent targets across early postnatal development: (d) less than postnatal day (P)5; (e) during L4 critical period plasticity (P5–9; (f) post-critical period plasticity (P9–12).
Figure 10
Figure 10. Transient translaminar synaptic connections arising from L5b Nkx2-1 interneuron subtypes.
(a) During the critical period plasticity L2/3 pyramidal cells received local Nkx2-1 input but exhibited an increase in L5b input post-critical period (b,c). *P=0.016, Kruskal–Wallis test, Dunn correction for multiple comparisons. (d) L4 neurons received strong L5b input during the critical period that was subsequently (e) confined primarily to the immediate barrel. (f) Laminar distribution of input arising from Nxk2-1 interneuron over development; **P<0.001, Kruskal–Wallis test, Dunn correction. (gi) LSPS data from L4 glutamatergic neurons in animals in which our optogenetic actuator was bred onto SST-ires-Cre background. (g) L5b SST+ cells provide early translaminar input onto L4 cells that is absent post P8 (h). (i) The laminar distribution of SST+ interneuron input onto L4 PYRs; **P<0.001, Kruskal–Wallis test, Dunn correction. Scale bar, P5–8, 0–10%; P9–12, 0-6%.

Similar articles

Cited by

References

    1. Ben-Ari Y., Khalilov I., Represa A. & Gozlan H. Interneurons set the tune of developing networks. Trends Neurosci. 27, 422–427 (2004). - PubMed
    1. Hensch T. K. Critical period plasticity in local cortical circuits. Nat. Rev. Neurosci. 6, 877–888 (2005). - PubMed
    1. Markram H. et al.. Interneurons of the neocortical inhibitory system. Nat. Rev. Neurosci. 5, 793–807 (2004). - PubMed
    1. Pfeffer C. K., Xue M., He M., Huang Z. J. & Scanziani M. Inhibition of inhibition in visual cortex: the logic of connections between molecularly distinct interneurons. Nat. Neurosci. 16, 1068–1076 (2013). - PMC - PubMed
    1. Klausberger T. & Somogyi P. Neuronal diversity and temporal dynamics: the unity of hippocampal circuit operations. Science 321, 53–57 (2008). - PMC - PubMed

Publication types

LinkOut - more resources