. 2016 Feb 3;36(5):1502-15.
doi: 10.1523/JNEUROSCI.1930-15.2016.

Blockade of Astrocytic Calcineurin/NFAT Signaling Helps to Normalize Hippocampal Synaptic Function and Plasticity in a Rat Model of Traumatic Brain Injury

Affiliations

Blockade of Astrocytic Calcineurin/NFAT Signaling Helps to Normalize Hippocampal Synaptic Function and Plasticity in a Rat Model of Traumatic Brain Injury

Jennifer L Furman et al. J Neurosci. .

Abstract

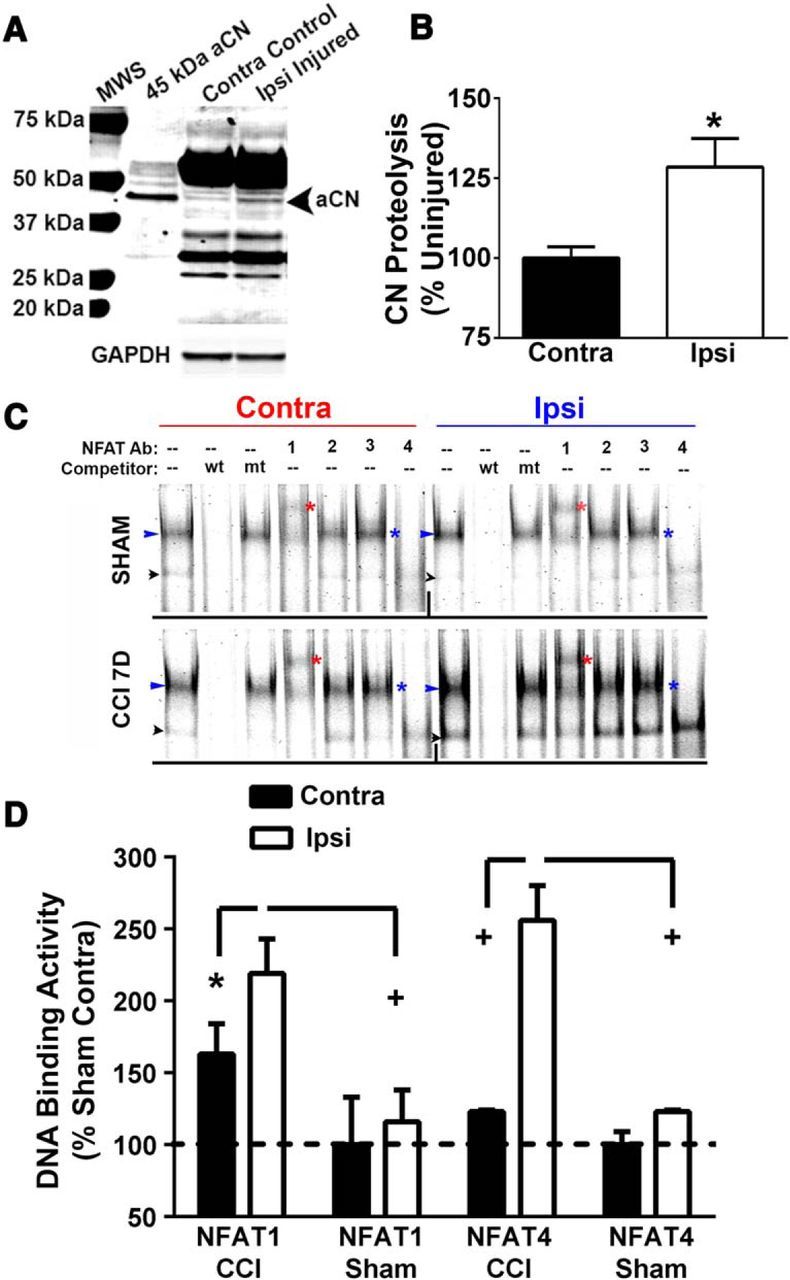
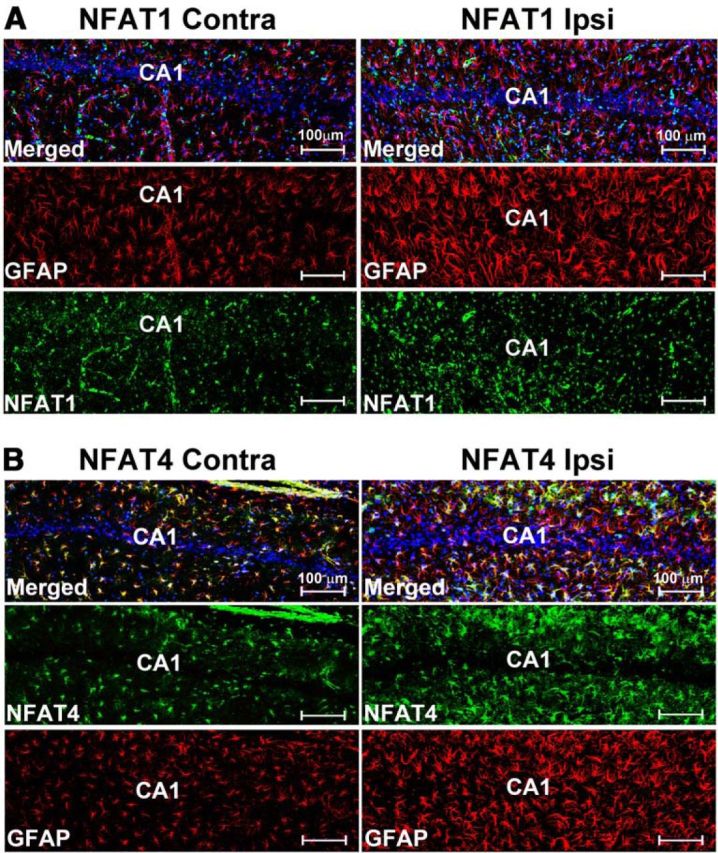
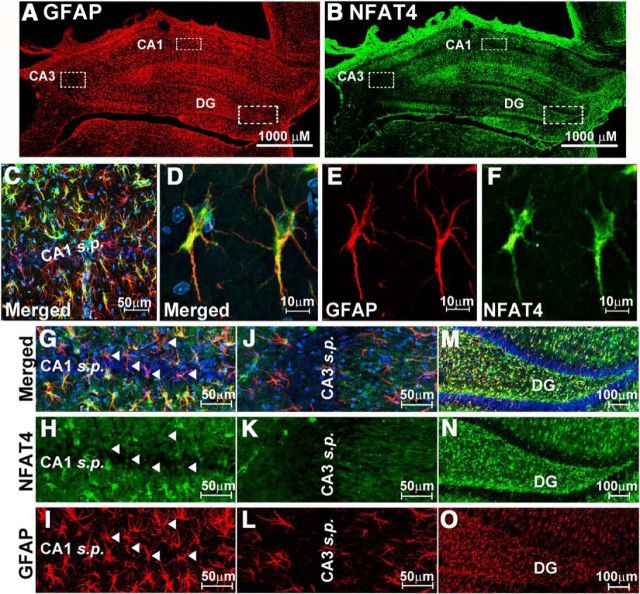
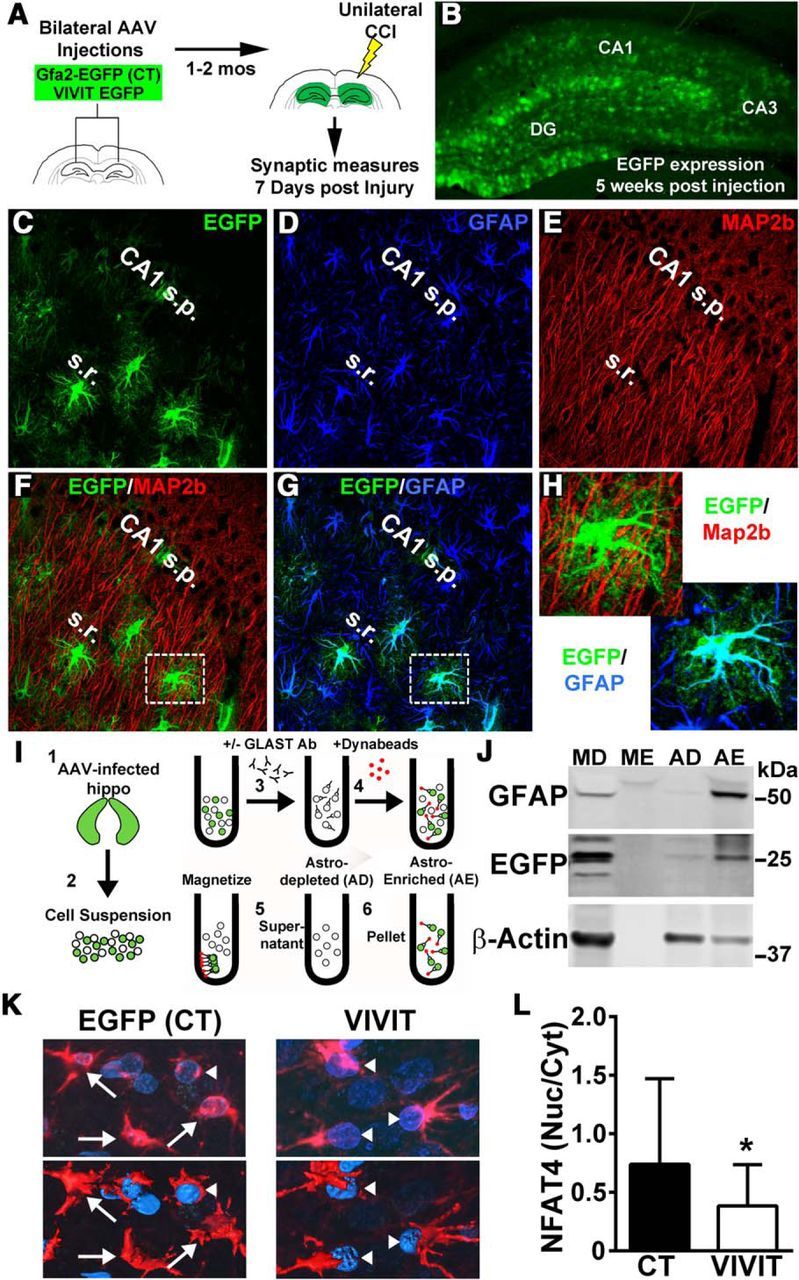
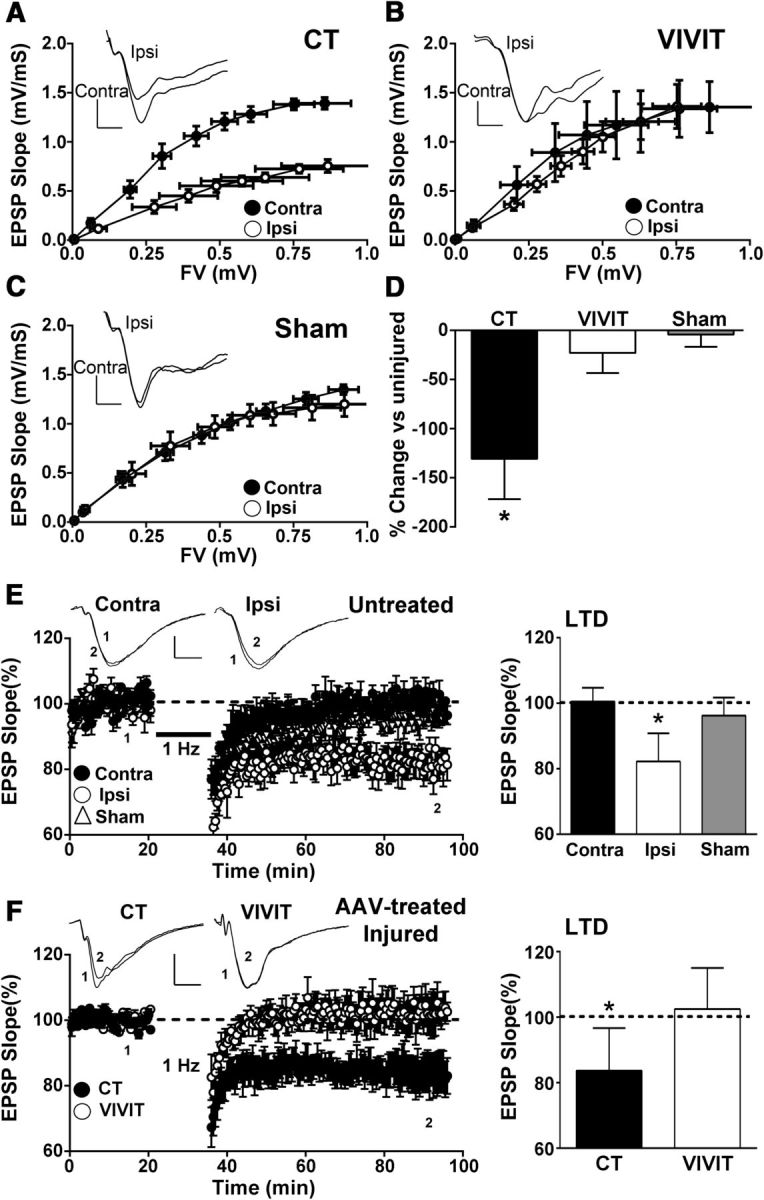
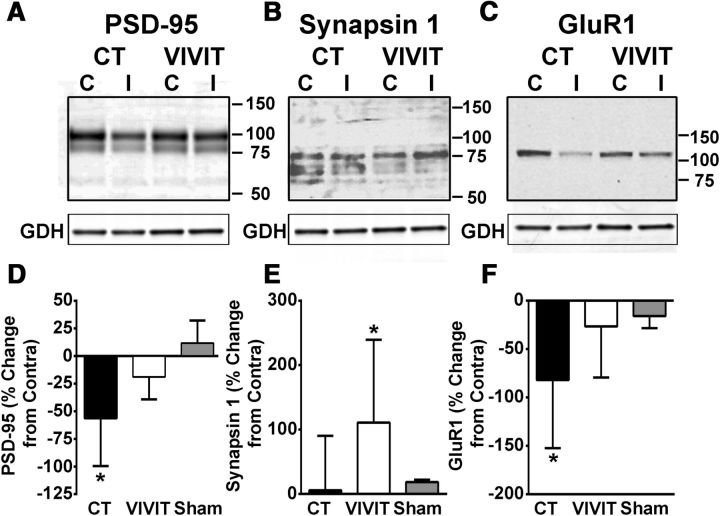
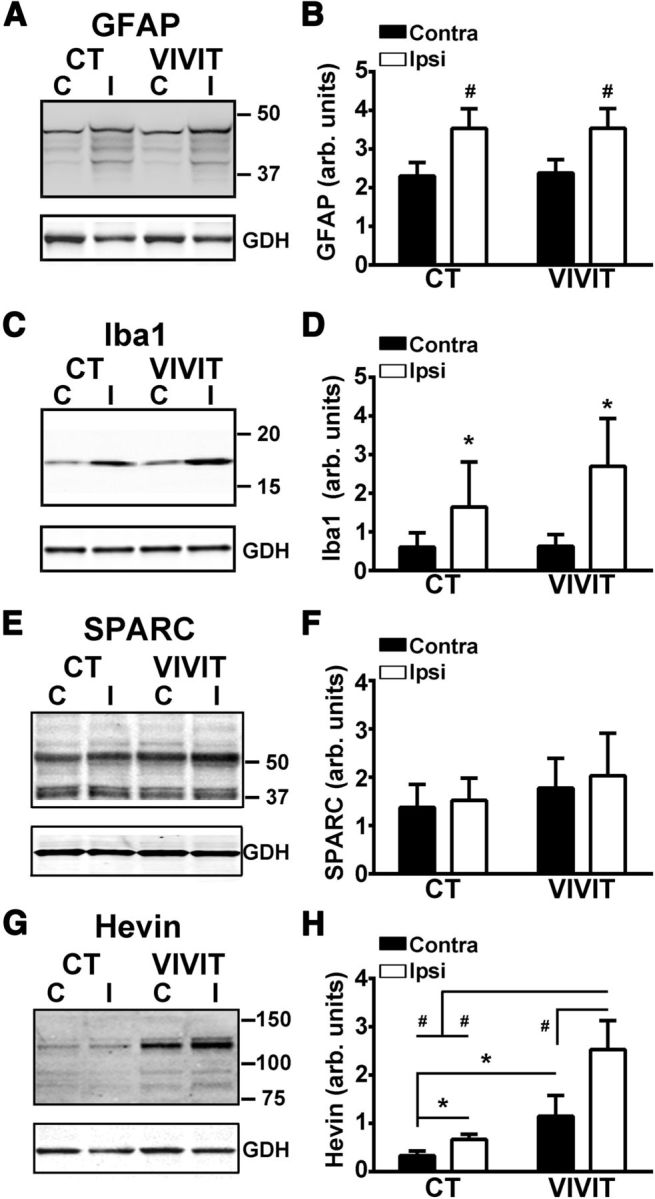
Increasing evidence suggests that the calcineurin (CN)-dependent transcription factor NFAT (Nuclear Factor of Activated T cells) mediates deleterious effects of astrocytes in progressive neurodegenerative conditions. However, the impact of astrocytic CN/NFAT signaling on neural function/recovery after acute injury has not been investigated extensively. Using a controlled cortical impact (CCI) procedure in rats, we show that traumatic brain injury is associated with an increase in the activities of NFATs 1 and 4 in the hippocampus at 7 d after injury. NFAT4, but not NFAT1, exhibited extensive labeling in astrocytes and was found throughout the axon/dendrite layers of CA1 and the dentate gyrus. Blockade of the astrocytic CN/NFAT pathway in rats using adeno-associated virus (AAV) vectors expressing the astrocyte-specific promoter Gfa2 and the NFAT-inhibitory peptide VIVIT prevented the injury-related loss of basal CA1 synaptic strength and key synaptic proteins and reduced the susceptibility to induction of long-term depression. In conjunction with these seemingly beneficial effects, VIVIT treatment elicited a marked increase in the expression of the prosynaptogenic factor SPARCL1 (hevin), especially in hippocampal tissue ipsilateral to the CCI injury. However, in contrast to previous work on Alzheimer's mouse models, AAV-Gfa2-VIVIT had no effects on the levels of GFAP and Iba1, suggesting that synaptic benefits of VIVIT were not attributable to a reduction in glial activation per se. Together, the results implicate the astrocytic CN/NFAT4 pathway as a key mechanism for disrupting synaptic remodeling and homeostasis in the hippocampus after acute injury.

Significance statement: Similar to microglia, astrocytes become strongly "activated" with neural damage and exhibit numerous morphologic/biochemical changes, including an increase in the expression/activity of the protein phosphatase calcineurin. Using adeno-associated virus (AAV) to inhibit the calcineurin-dependent activation of the transcription factor NFAT (Nuclear Factor of Activated T cells) selectively, we have shown that activated astrocytes contribute to neural dysfunction in animal models characterized by progressive/chronic neuropathology. Here, we show that the suppression of astrocytic calcineurin/NFATs helps to protect synaptic function and plasticity in an animal model in which pathology arises from a single traumatic brain injury. The findings suggest that at least some astrocyte functions impair recovery after trauma and may provide druggable targets for treating victims of acute nervous system injury.

Keywords: astrocytes; brain injury; calcineurin; calcium; glia; synapse.


Figures

Figure 1.
Figure 1.
Changes in CN and NFAT signaling properties at 7 d after CCI. A, Representative Western blot for the CN A subunit in rat hippocampal whole-cell lysates from rat contralateral and ipsilateral hemispheres at 7 d after CCI. Whole-cell lysates from primary astrocyte cultures infected with adenovirus (Ad) expressing a constitutively active 45 kDa CN fragment (aCN) were run in parallel. Injury was associated with an increase in the proteolysis of CN to a 45–48 kDa fragment, similar in size to the fragment found in Ad-aCN-infected astrocyte cultures. B, Mean ± SD level (percentage contralateral hemiphere levels) of proteolysis in hippocampal homogenates in contralateral and ipsilateral hemispheres. p < 0.05, paired t test. C, Representative EMSA for hippocampal homogenates from the ipsilateral and contralateral hemispheres of rats exposed to CCI or to sham surgery. NFAT-binding probe was added to homogenates with and without antibodies (Ab) to each of the 4 CN-dependent NFAT isoforms to show supershifts and/or block shifts. Unlabeled WT (wt) and mutant (mt) DNA probe was included in some conditions to demonstrate DNA-binding specificity of the labeled probe. Bands denoted by the blue arrowheads reflect total NFAT binding. Red asterisks point to bands that were supershifted in response to inclusion of the NFAT1 antibody. Blue asterisks appear next to lanes where the NFAT4 antibody was included with the DNA-binding probe and illustrate a clear block shift. The black arrowheads point to bands that were relatively insensitive to antibody treatment conditions and likely reflect nonspecific binding. No gel shifts or block shifts were seen after inclusion of the NFAT 2 and 3 antibodies, suggesting that these isoforms did not significantly contribute to total NFAT binding under these conditions. D, Mean ± SD DNA-binding activity expressed as percentage of sham contralateral condition levels. NFAT1 was assessed from the supershifted bands obtained with the NFAT1 antibody (see red asterisks in C). NFAT 4 was assessed from the bands associated with blue arrowheads in C. n.s., Nonsignificant ipsilateral versus contralateral; *p < 0.05; + p < 0.01 ipsilateral versus contralateral, Fisher's PLSD test.
Figure 2.
Figure 2.
Confocal microscopic images showing the expression of NFATs 1 and 4 in the hippocampus at 7 d after CCI. A, B, NFAT and GFAP labeling shown separately and together (merged) in the CA1 region of the hippocampus in contralateral and ipsilateral hemispheres at 7 d after CCI. For each NFAT isoform, images were obtained from the same coronal plane of the same animal and are shown with identical brightness and contrast settings. Both NFATs are expressed throughout stratum radiatum and stratum oriens in the contralateral and ipsilateral hemispheres. NFAT1 (A) exhibited a more punctate labeling pattern in the ipsilateral hemisphere, but there was little to no colocalization with GFAP-positive astrocytes regardless of injury. In contrast, NFAT4 (B) was extensively colocalized to GFAP-positive astrocytes (see numerous yellow/orange cells in merged images) in both hemispheres and was upregulated as a result of injury.
Figure 3.
Figure 3.
Heterogenous expression of NFAT4 in hippocampus. A, B, Low-power confocal micrographs of the same coronal slice (ipsilateral hemisphere) showing GFAP (A) and NFAT4 (B) labeling at 7 d after CCI. CF, Low- (C) and high-powered (DF) confocal images of NFAT4 and GFAP shown alone (E, F) or merged (C, D) in area CA1 of the hippocampus of the ipsilateral hemisphere. Micrographs illustrate extensive colocalization of NFAT4 throughout astrocyte somata, nuclei and major processes. GO, NFAT4 and GFAP labeling in CA1 (GI), CA3 (JL), and the dentate gyrus (MO) of the ipsilateral hemisphere. In CA1 and the DG, NFAT4 is found in most astrocytes. The exception is for those astrocytes found immediately adjacent to neuronal cell body layers, many of which are apparently devoid of NFAT4 (e.g., see arrowheads in GI). Although numerous GFAP-positive astrocytes were found throughout the CA3 region, relatively few of these cells exhibited NFAT4 colabeling.
Figure 4.
Figure 4.
AAV-Gfa2 vectors for targeting astrocytic CN/NFAT signaling. A, AAV-Gfa2 vectors expressing EGFP alone (CT) or EGFP fused with the NFAT-inhibitory peptide VIVIT were bilaterally injected into the hippocampus of adult rats. At 1–2 months after injection, rats received a unilateral CCI and biomeasures were taken at 7 d after injury. B, Extensive EGFP expression throughout the molecular layers of the rat hippocampus at 5 weeks after injection. CH, Confocal micrographs showing labeling patterns for EGFP (C, F), GFAP (D, G), and the neuronal marker MAP2B (E, F) from an AAV-Gfa2-EGFP-infected rat. Higher-magnification images of the regions shown in F and G are shown in H. There was extensive colocalization between EGFP and GFAP, but nearly no colocalization between EGFP and MAP2b (F, H). I, Diagram illustration of the protocol used to immunodeplete astrocytes from intact hippocampal tissue of AAV-Gfa2-EGFP infected rats. Single-cell suspensions were prepared from hippocampal tissue (Steps 1 and 2) and then added to a Microfuge tube. GLAST antibody was added (Step 3) to tag astrocytes. Metal Dynabeads were then added (Step 4) and tubes were placed in a magnetic rack. The supernatant containing unbound cells was collected (Step 5) and are referred to as the AD fraction, whereas the antibody-bound fraction contained in the pellet (Step 6) is referred to as the AE fraction. J, Representative Western blot showing the expression of GFAP, EGFP, and β-actin loading control in AD and AE fractions. MD and ME fractions (no GLAST antibody added) were run in parallel as controls. EGFP appears in the AE fraction, but not in the AD fraction, confirming that AAV-Gfa2 targets astrocytes selectively. K, Confocal micrographs showing the cellular localization of NFAT4 (red) in EGFP-expressing cells in rats infected with AAV-Gfa2-EGFP (CT) or AAV-Gfa2-VIVIT-EGFP. Note that astrocyte nuclei are labeled blue (DAPI). Top panels are 2D confocal images and the bottom panels are 3D-rendered images generated from Z stacks. Note that, for clarity, the EGFP signal is not shown. Arrows point to cells where NFAT4 is found distributed across both the cytosolic and nuclear compartments. Arrowheads point to cells where NFAT4 is largely excluded from the nucleus. L, Mean ± SD for the nuclear-to-cytosolic ratio for NFAT4 in rats treated with AAV-Gfa2-EGFP or AAV-Gfa2-VIVIT (n = 3 rats per group). VIVIT-treated rats show a significant reduction in the nuclear localization of NFATs. *p < 0.01, Student's t test.
Figure 5.
Figure 5.
Effects of AAV-Gfa2-VIVIT on synaptic strength and plasticity. A, B, CA1 synaptic strength curves constructed from the mean ± SEM EPSP slope versus the mean ± SEM FV amplitude for hippocampal slices from the contralateral and ipsilateral hemispheres of rats treated with control (CT) AAV-Gfa2-EGFP (A) or with AAV-Gfa2-VIVIT (B). Slices from contralateral and ipsilateral hemispheres of sham-operated rats (C) are also shown for comparison. Insets in AC show representative EPSP waveforms in each hemisphere matched on the basis of FV amplitude. Note, that for AAV-Gfa2-EGFP CT rats (A), the synaptic strength curve exhibited a marked downward shift in the ipsilateral relative to the contralateral hemisphere. In contrast, synaptic strength curves across hemispheres are qualitatively and quantitatively similar in sham rats (C) and rats treated with AAV-Gfa2-VIVIT (B). D, Mean ± SD of the EPSP-to-FV ratio in the ipsilateral hemisphere of AAV-treated and sham rats expressed as percentage change from the contralateral hemisphere. A reduction in the EPSP-to-FV ratio is only observed for AAV-Gfa2-EGFP CT rats.*p < 0.01 ipsilateral versus contralateral, Fisher's PLSD test. E, Left, Time plots showing mean ± SEM EPSP slope values (% baseline) from slices collected from the contralateral and ipsilateral hemispheres of untreated rats (i.e., no AAV) and the ipsilateral hemisphere of sham-operated rats. EPSPs were recorded before and for 60 min after delivery of a 15 min train of 1 Hz stimulation (bar). Representative waveforms in slices from each hemisphere of CCI rats measured before (1) and 60 min after (2) 1 Hz stimulation are shown in the inset. Calibration bars are 0.5 mV/5 ms. E, Right, Mean ± SD EPSP slope at 60 min after 1 Hz stimulation in contralateral and ipsilateral hemispheres and also in the ipsilateral hemisphere of sham-operated rats. Significant LTD was only observed in slices from the ipsilateral hemisphere of injured rats, *p < 0.05 Fisher's PLSD test. F, Left, LTD time plots (mean ± SEM EPSP slopes) and bar graphs (right) showing mean ± SD EPSP values (% baseline) at 60 min after 1 Hz stimulation in slices collected from the ipsilateral (injured) hemispheres of AAV-treated rats. Insets show representative waveforms as described for E. Note that LTD is present in the ipsilateral hemisphere of rats pretreated with AAV-Gfa2-EGFP control vector (CT), but not in rats treated with AAV-Gfa2-VIVIT. *p < 0.05, Fisher's PLSD test.
Figure 6.
Figure 6.
AAV-Gfa2-VIVIT protects against the loss of synaptic proteins. AC, Representative Western blots and mean ± SD levels (DF) for hippocampal synaptic proteins in the contralateral and ipsilateral hemispheres of rats treated with AAV-Gfa2-EGFP (CT) or AAV-Gfa2-VIVIT. Protein levels in DF are from the ipsilateral hemisphere and are expressed as the percentage change from the contralateral hemisphere. The percentage change in the ipsilateral versus contralateral hemisphere of sham controls are also provided. Levels for PSD95 and GluR1 showed significant reductions in the ipsilateral hemisphere of AAV-Gfa2-EGFP rats, *p < 0.05 ipsilateral versus contralateral, Fisher's PLSD test, but not in the ipsilateral hemisphere of VIVIT-treated rats. Although Syn1 was not significantly reduced with injury, protein levels in the ipsilateral hemisphere were significantly increased by pretreatment with AAV-Gfa2-VIVIT. *p < 0.05 ipsilateral versus contralateral, Fisher's PLSD test, n = 5–6 rats per group.
Figure 7.
Figure 7.
AAV-Gfa2-VIVIT does not alter GFAP or Iba1 levels, but causes an increase in hevin levels. Representative Western blots (A, C) and mean ± SD. GFAP and Iba1 protein levels (B, D) in the contralateral and ipsilateral hippocampus of AAV-treated rats at 7 d after CCI. Note that both glial markers showed a significant increase in the hippocampus of the ipsilateral hemisphere, but were not significantly altered by pretreatment with AAV-Gfa2-VIVIT. #p < 0.001 ipsilateral versus contralateral, Fisher's PLSD. n = 5–6 rats, group. EH, Representative Western blots (E, G) and mean ± SD SPARC and hevin protein levels (F, H) in the contralateral and ipsilateral hippocampus of AAV-treated rats at 7 d after CCI. No virus or injury-dependent effects were observed for SPARC. In contrast, hevin was sensitive to both injury and AAV treatment. In both AAV groups, hevin was elevated in the ipsilateral relative to the contralateral hemisphere. Overall hevin levels were greater in the VIVIT-treated group regardless of hemisphere, but were highest in the injured hemisphere. *p < 0.05; #p < 0.001 ipsilateral versus contralateral, Fisher's LSD, n = 5–6 rats.

Similar articles

Cited by

References

    1. Abdul HM, Sama MA, Furman JL, Mathis DM, Beckett TL, Weidner AM, Patel ES, Baig I, Murphy MP, LeVine H, 3rd, Kraner SD, Norris CM. Cognitive decline in Alzheimer's disease is associated with selective changes in calcineurin/NFAT signaling. J Neurosci. 2009;29:12957–12969. doi: 10.1523/JNEUROSCI.1064-09.2009. - DOI - PMC - PubMed
    1. Albrecht D, López-Murcia FJ, Pérez-González AP, Lichtner G, Solsona C, Llobet A. SPARC prevents maturation of cholinergic presynaptic terminals. Mol Cell Neurosci. 2012;49:364–374. doi: 10.1016/j.mcn.2012.01.005. - DOI - PubMed
    1. Anderson MA, Ao Y, Sofroniew MV. Heterogeneity of reactive astrocytes. Neurosci Lett. 2014;565:23–29. doi: 10.1016/j.neulet.2013.12.030. - DOI - PMC - PubMed
    1. Ansari MA, Roberts KN, Scheff SW. Dose- and time-dependent neuroprotective effects of Pycnogenol following traumatic brain injury. J Neurotrauma. 2013;30:1542–1549. doi: 10.1089/neu.2013.2910. - DOI - PMC - PubMed
    1. Aramburu J, Yaffe MB, López-Rodríguez C, Cantley LC, Hogan PG, Rao A. Affinity-driven peptide selection of an NFAT inhibitor more selective than cyclosporin A. Science. 1999;285:2129–2133. doi: 10.1126/science.285.5436.2129. - DOI - PubMed

Publication types

MeSH terms

LinkOut - more resources