. 2016 Feb 3;36(5):1547-63.
doi: 10.1523/JNEUROSCI.2874-15.2016.

Nonspatial Sequence Coding in CA1 Neurons

Affiliations

Nonspatial Sequence Coding in CA1 Neurons

Timothy A Allen et al. J Neurosci. .

Abstract

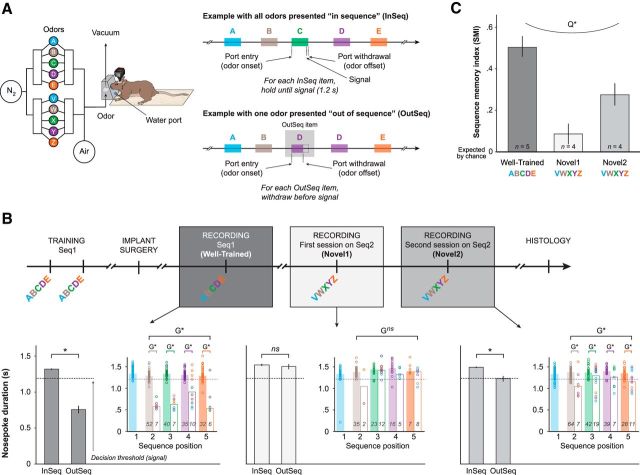
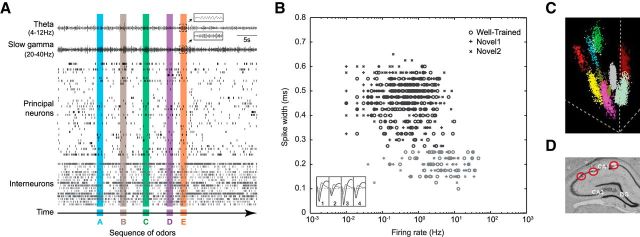
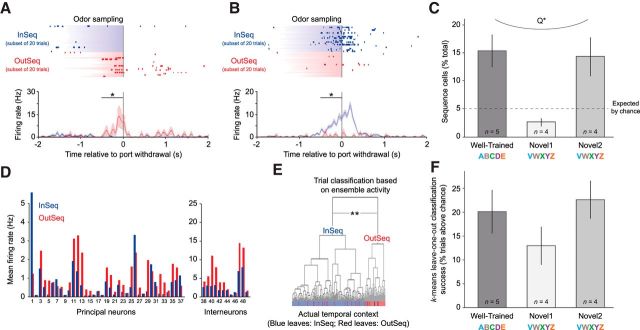
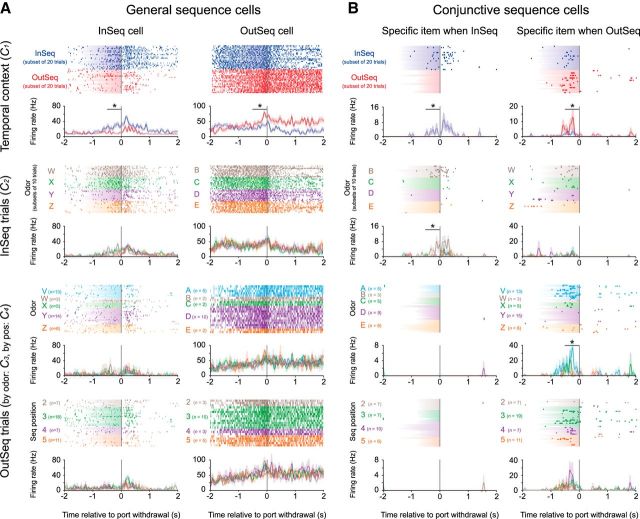
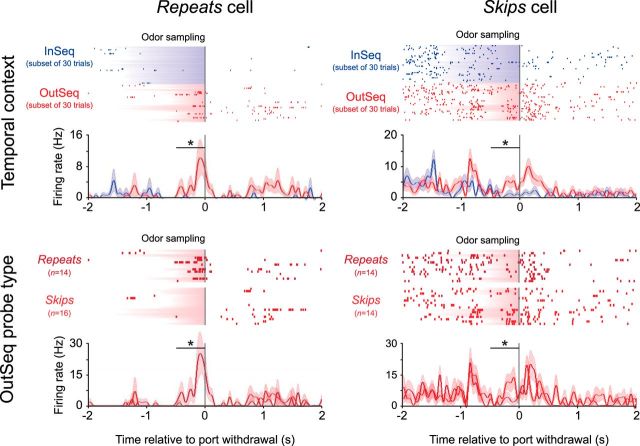
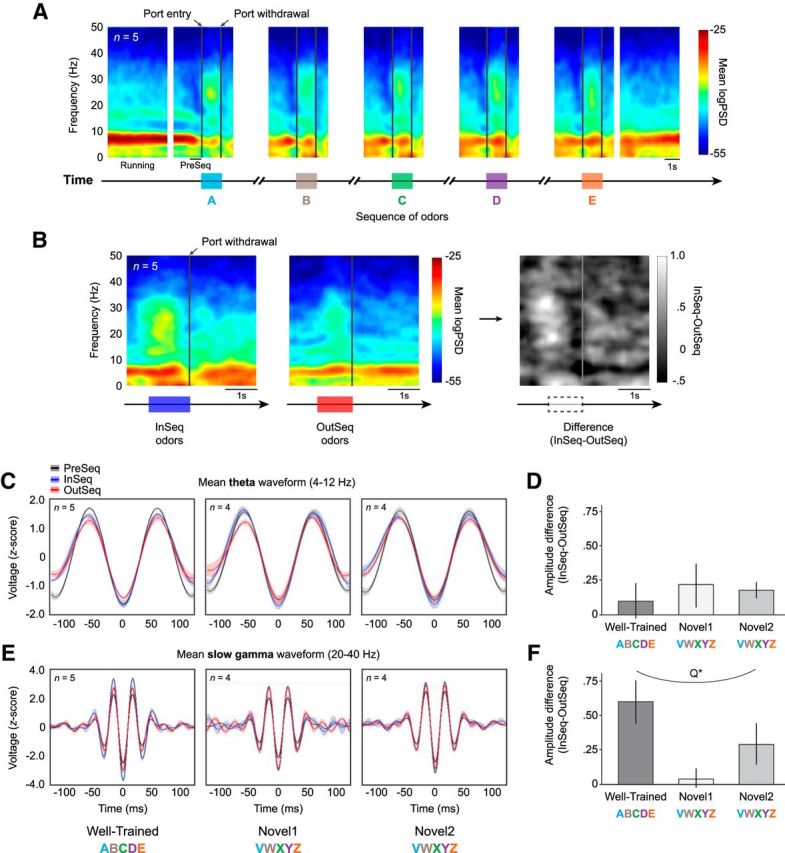
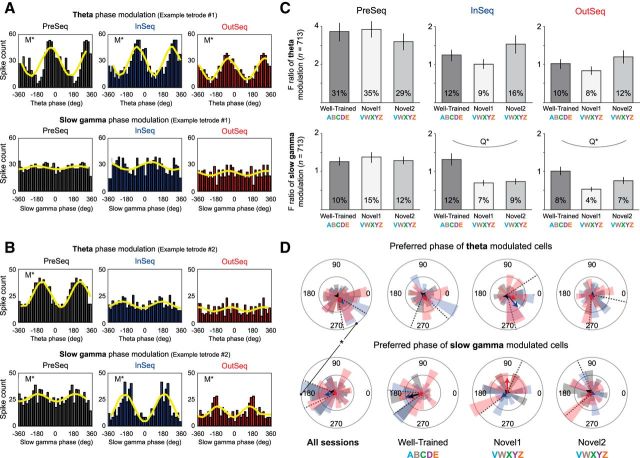
The hippocampus is critical to the memory for sequences of events, a defining feature of episodic memory. However, the fundamental neuronal mechanisms underlying this capacity remain elusive. While considerable research indicates hippocampal neurons can represent sequences of locations, direct evidence of coding for the memory of sequential relationships among nonspatial events remains lacking. To address this important issue, we recorded neural activity in CA1 as rats performed a hippocampus-dependent sequence-memory task. Briefly, the task involves the presentation of repeated sequences of odors at a single port and requires rats to identify each item as "in sequence" or "out of sequence". We report that, while the animals' location and behavior remained constant, hippocampal activity differed depending on the temporal context of items-in this case, whether they were presented in or out of sequence. Some neurons showed this effect across items or sequence positions (general sequence cells), while others exhibited selectivity for specific conjunctions of item and sequence position information (conjunctive sequence cells) or for specific probe types (probe-specific sequence cells). We also found that the temporal context of individual trials could be accurately decoded from the activity of neuronal ensembles, that sequence coding at the single-cell and ensemble level was linked to sequence memory performance, and that slow-gamma oscillations (20-40 Hz) were more strongly modulated by temporal context and performance than theta oscillations (4-12 Hz). These findings provide compelling evidence that sequence coding extends beyond the domain of spatial trajectories and is thus a fundamental function of the hippocampus.

Significance statement: The ability to remember the order of life events depends on the hippocampus, but the underlying neural mechanisms remain poorly understood. Here we addressed this issue by recording neural activity in hippocampal region CA1 while rats performed a nonspatial sequence memory task. We found that hippocampal neurons code for the temporal context of items (whether odors were presented in the correct or incorrect sequential position) and that this activity is linked with memory performance. The discovery of this novel form of temporal coding in hippocampal neurons advances our fundamental understanding of the neurobiology of episodic memory and will serve as a foundation for our cross-species, multitechnique approach aimed at elucidating the neural mechanisms underlying memory impairments in aging and dementia.

Keywords: electrophysiology; episodic memory; hippocampus; rats; sequence memory; temporal context.


Figures

Figure 1.
Figure 1.
Sequence memory task design and performance. Neural activity was recorded as rats performed the cross-species sequence memory task we recently developed, which shows strong behavioral parallels in rats and humans (Allen et al., 2014). Briefly, this hippocampus-dependent task involves repeated presentations of sequences of nonspatial items (odors) and requires subjects to determine whether each item is presented InSeq or OutSeq. Importantly, this nonspatial approach allows us to specifically focus on the temporal demands of the task (by holding spatial location and motor behavior constant) and use different types of probe trials to shed light on underlying sequence representations and cognitive processes. A, Apparatus and behavioral design. Using an automated odor delivery system (left), rats were presented with series of five odors delivered in the same odor port. In each session, the same sequence was presented multiple times (right), with approximately half the presentations including all items InSeq (ABCDE) and the other half including one item OutSeq (e.g., ABDDE). Each odor presentation was initiated by a nosepoke and rats were required to correctly identify the odor as either InSeq (by holding their nosepoke response until the signal at 1.2 s) or OutSeq (by withdrawing their nosepoke before the signal; <1.2 s) to receive a water reward. B, Experimental timeline (top). Rats were trained preoperatively on Sequence 1 (Seq1; ABCDE) until they reached asymptotic performance. Subsequently, neural activity in region CA1 was recorded while rats continued to be tested on Seq1 for a few sessions, followed by sessions testing a novel sequence (Seq2: VWXYZ). We focused our analyses on three recording sessions per animal: the session with the strongest (Well-Trained; Seq1) and weakest (Novel1; first session on Seq2) levels of sequence memory performance, as well as a session exhibiting intermediate levels of performance (Novel2; second session on Seq2). Example performance from a representative rat on each of the three recording sessions of interest (bottom). Main bar graphs show the mean nosepoke duration on InSeq and OutSeq items, whereas inset plots show the same data sorted by ordinal position in the sequence (x-axis) and by item (color). The color of individual circles represents the correct sequence position for each odor presentation: first sequence position in light blue (A or V), second in brown (B or W), third in green (C or X), fourth in purple (D or Y), and fifth in orange (E or Z). Bars represent the median nosepoke duration for each sequence position (filled bar, InSeq; open bar, OutSeq; n's indicated by values on bars). These data indicate that the rat reliably differentiated between InSeq and OutSeq items in the Well-Trained session but not in Novel1, with moderate levels of performance in Novel2 (performance levels approximating group means shown in C). Note that only InSeq items (A or V) were presented on the first sequence position. C, Group performance on the three recording sessions of interest (Well-Trained, Novel1, and Novel2). We used a sequence memory index (SMI; Allen et al., 2014; see Materials and Methods) to collapse the behavioral data of each session into a single normalized measure of sequence memory performance. An SMI value of 1 represents perfect performance (correctly holding on all InSeq items and correctly withdrawing on all OutSeq items), while 0 represents chance performance (identical ratio of hold and withdraw responses for InSeq and OutSeq items). Rats exhibited strong, weak, and intermediate levels of sequence memory performance across the three sessions. *, Significant t test; ns, nonsignificant t test; G*, significant G test; Gns, nonsignificant G test; Q*, significant quadratic fit across sessions.
Figure 2.
Figure 2.
Electrophysiological recordings. Spiking activity and local field potentials (LFP) were recorded from the dorsal CA1 region of the hippocampus during task performance. All well-isolated neurons (713 neurons from 13 sessions) were included in the analyses. Raw LFP traces were filtered for 4–12 Hz band (theta) and 20–40 Hz band [beta or low gamma range; labeled slow-gamma here according to Colgin et al. (2009)]. A, Example activity from simultaneously recorded neurons (putative principal neurons and interneurons) and LFPs (theta and slow-gamma bands) during one sequence presentation. Inset plots show expanded snapshots of theta and slow-gamma oscillations during an odor presentation. B, Scatterplot showing the distribution of putative principal neurons and interneurons across the three sessions of interest (Well-Trained, Novel1, Novel2). The majority (84%) of isolated neurons were classified as putative principal neurons (599 principal neurons, 114 interneurons; see Materials and Methods). Importantly, the principal-to-interneuron ratio and the size of simultaneously recorded neuronal ensembles were consistent across sessions. Inset plot shows representative mean waveforms recorded from the same tetrode (dark gray, pyramidal neurons; light gray, interneurons). C, Example 3-D cluster plot of spike amplitude across wires showing nine simultaneously recorded neurons on a single tetrode. D, Sample histology slice showing the range of tetrode tip locations (3 tip locations shown; red circles). Tetrodes were targeted at the location denoted by the CA1 label (anteroposterior, −4.0 mm; mediolateral, 3.5 mm). Less than 10% of the tetrodes were located near or in the CA2 region.
Figure 3.
Figure 3.
Nonspatial sequence coding in hippocampal neurons was linked to sequence memory performance. A–C, Single-unit analyses revealed that, while the animals' nose remained in the port, many individual hippocampal neurons fired differentially, depending on the temporal context of the odor presented (whether it was presented InSeq or OutSeq). The majority (73.8%) of these cells (“sequence cells”) exhibited significantly higher firing rates on odors presented OutSeq compared with InSeq (A, example cell), while the others showed the opposite pattern of activity (26.2%; B, example cell). Rasters (top) display spikes (ticks) and odor-sampling periods (shading) on individual trials. Perievent time histograms (bottom) show mean firing rates across all trials (±SEM), binned over 50 ms with minimal smoothing. Note that rasters display equivalent numbers of InSeq and OutSeq trials for clarity but that histograms and statistical analyses (permutation tests; see Materials and Methods) included all trials with odor-sampling periods of ≥500 ms. C, The prevalence of sequence cells was positively associated with performance levels. Many sequence cells were observed when animals performed well in the task (3× the proportion expected by chance on Well-Trained and Novel2 sessions), but the proportion of such cells was no greater than expected by chance when animals showed poor memory for the sequence (Novel1). This parallel with performance was confirmed by a significant quadratic fit of the magnitude of sequence-cell coding (t ratios of all cells on InSeq vs OutSeq test) across the three sessions. D–F, Activity from ensembles of simultaneously recorded neurons strongly differentiated between InSeq and OutSeq items (D, example ensemble). E, Hierarchical clustering analyses revealed that the top two clusters of ensemble activity vectors in multidimensional space (and only clustering to reach statistical significance) reflected the InSeq/OutSeq status of trials. F, k-means leave-one-out clustering analyses showed that the proportion of trials accurately decoded as InSeq or OutSeq was also positively associated with performance. More specifically, k-means leave-one-out classification accuracy was higher on sessions with strong sequence memory performance (Well-Trained and Novel2) than on sessions with weak sequence memory (Novel1) and was correlated with behavioral performance (data not shown). Error bars indicate ±1 SEM. *, Significant t test within 500 ms window indicated by bar (Bonferroni corrected for two 250 ms bins). **, Significant clusters. Q*, Significant quadratic fit across sessions.
Figure 4.
Figure 4.
General and conjunctive sequence coding. To identify potential subtypes, the activity of each sequence cell was examined across four different contrasts: InSeq versus OutSeq trials (C1), InSeq trials sorted by odor (C2), OutSeq trials sorted by Odor (C3), and OutSeq trials sorted by ordinal position in the sequence (C4). The activity of four example neurons (one per column) is shown here across the four contrasts (rows) to illustrate some of the observed subtypes. Shaded area in rasters represents odor-sampling durations on individual trials. Perievent time histograms show mean firing rates across all trials (±1 SEM), binned over 50 ms with minimal smoothing. Note that activity to the first odor of each sequence (A or V when presented InSeq) is not shown because it would introduce running-related activity before the nosepoke, making the plots more difficult to interpret. A, General sequence cells (60% of sequence cells) fired differentially to the overall InSeq/OutSeq status of items without apparent selectivity for the specific odors presented or the sequence positions in which they occurred (significant t test on C1, but nonsignificant ANOVAs on C2–C4). For instance, the left column shows an example of a neuron that significantly increased its firing rate on InSeq trials without clear selectivity across odors presented (compare rows 1, 2; InSeq cell). The right column shows a different neuron, in this case a putative interneuron, which significantly increased its firing rate on OutSeq trials but showed little selectivity for the odor presented or the sequence position in which it occurred (compare rows 1, 3, 4; OutSeq cell). B, Conjunctive sequence cells (40% of sequence cells) showed selectivity for specific conjunctions of item and sequence position information. Subtypes of conjunctive cells were identified according to which contrast (in addition to C1) yielded a statistically significant ANOVA. The first subtype (25% of conjunctive cells) exhibited differential activity when specific odors were presented InSeq (significant ANOVA on C2, but not on C3 or C4). For instance, the left column displays an example neuron for which the increased firing rate to InSeq items (Row 1) was primarily driven by a specificity to Odor B when presented InSeq (Row 2). The same neuron was virtually silent on OutSeq trials (Rows 3 and 4). Conversely, other conjunctive cells primarily coded for specific mismatches between item and sequence position information. In fact, the second subtype (46.9% of conjunctive cells) exhibited differential activity when specific odors were presented OutSeq (significant ANOVA on C3, but not on C2 or C4). For instance, the right column displays an example for which the higher activity on OutSeq trials (Row 1) was primarily driven by selectivity to Odor V when presented OutSeq (Row 3), with a nonsignificant influence of the sequence position in which it was presented (Row 4). The third subtype (37.5% of conjunctive cells) fired differentially when specific ordinal positions in the sequence included OutSeq items (significant ANOVA on C4, but not on C2 or C3; data not shown). *, Significant t test or ANOVA within 500 ms window indicated by bar (Bonferroni corrected for two 250 ms bins).
Figure 5.
Figure 5.
Probe-type-specific activity. Statistical analyses revealed that a proportion of sequence cells (34.5%) fired differentially across the two types of OutSeq probe trials (repeats and skips; Allen et al., 2014). Briefly, repeats consist of OutSeq trials in which an earlier item is presented a second time in the sequence (e.g., ABA), whereas skips are OutSeq trials in which an item is presented too early in the sequence (e.g., ABD, which skips over item C). The left column shows an example OutSeq cell selective for repeats (35% of probe-specific sequence cells) and the right column shows an example OutSeq cell exhibiting preferential firing to skips (65% of probe-specific sequence cells). As in Figure 3 and 4, rasters display neural activity for a subset of InSeq trials but perievent histograms (mean firing rate ± SEM) and statistical analyses include all trials. *, Significant t test within 500 ms window indicated by bar (Bonferroni corrected for two 250 ms bins).
Figure 6.
Figure 6.
Slow-gamma, but not theta, oscillations were modulated by the temporal context (InSeq/OutSeq) of items. A, Group PESG for all completed sequences, displayed in successive 4 s blocks aligned across trials and animals. The PESG shows a reliable shift between theta (4–12 Hz) and slow-gamma (20–40 Hz) oscillations during task performance. Although clear theta oscillations were observed during odor sampling, theta power was strongest during the running bouts between sequences. Conversely, slow-gamma oscillations were strongest during odor-sampling periods. The same pattern was also apparent at the level of individual rats or sequence presentations (data not shown). B, Group PESGs for InSeq odors (left), OutSeq odors (middle), and InSeq–OutSeq difference (right). Slow-gamma power was higher on InSeq than OutSeq trials, but theta power showed no clear modulation by the temporal context of odors. C, D, Theta amplitude was similar between InSeq and OutSeq trials across sessions. C, Mean theta waveforms (z-score normalized amplitude ±SEM) during InSeq and OutSeq trials (500 ms preceding port withdrawal), with PreSeq period shown for comparison (500 ms preceding presentation of first odor). D, Mean differences in z-score normalized theta ampitude (±SEM) between InSeq and OutSeq trials. E, F, Significant differences in slow-gamma amplitude were observed between InSeq and OutSeq trials across sessions. E, Mean slow-gamma waveforms (z-score normalized amplitude ± SEM) during InSeq and OutSeq trials, with PreSeq period showed for comparison. F, Mean differences in z-score normalized slow-gamma ampitude (±SEM) between InSeq and OutSeq trials were associated with performance levels across sessions (significant quadratic fit). Q*, Significant quadratic fit.
Figure 7.
Figure 7.
Spike–phase relationships did not strongly differentiate the temporal context of items, but the magnitude of slow-gamma modulation showed a robust association with sequence memory performance. A, Spiking activity from example tetrode showing significant theta modulation across PreSeq and odor-sampling periods (InSeq or OutSeq; top) but no significant slow-gamma modulation (bottom). All spike–phase relationships were determined using the local LFP for each cell and tetrode (x-axis: 0° represents the trough of theta or slow gamma, and 180° the peak). Yellow waveforms represent the sine waves fitted to the spike–phase distributions. B, Example from another tetrode showing significant theta modulation during the PreSeq period (but not during odor sampling; top) and significant slow-gamma modulation across time periods (bottom). C, Magnitude of theta (top) or slow-gamma (bottom) modulation across sampling periods and sessions (mean F ratio across all cells ± SEM; n = 713). The magnitude of the phase modulation during odor sampling (InSeq or OutSeq) significantly paralleled performance across sessions for slow gamma (significant quadratic fit). The same pattern did not reach significance for theta, as the variability was considerably higher (note large SEM despite n's of 713). Theta and slow-gamma modulations showed a small but significant difference between InSeq and OutSeq trials (small effect sizes according to Cohen's d). Percentages on bars indicate proportions of significantly modulated cells. D, Preferred phase of spiking activity for cells with significant theta (top) or slow-gamma (bottom) modulation. Circular histograms show the proportion of cells with significant preferred phases across 18° bins (inner circles indicate a proportion of 0.05; outer circles, 0.15). Arrows show the resultant vector length (inner circles indicate r = 0.05; outer circles, r = 0.15) and direction (circular mean). No significant differences were observed across sampling periods (PreSeq, InSeq, or OutSeq) for any of the plots. All sessions combined (left): the mean preferred phase (collapsed across sampling periods) was significantly different between theta and slow gamma (theta: 305.04°; slow gamma: 181.45°; dotted lines indicate 95% confidence intervals of means). A qualitatively similar pattern was observed in each session (Well-Trained, Novel1, Novel2) but the resulting reduction in sampling increased error variance and the effects did not reach significance. M*, Significant modulation (theta or slow gamma); Q*, significant quadratic fit; *, significant difference in preferred phase.

References

    1. Agster KL, Fortin NJ, Eichenbaum H. The hippocampus and disambiguation of overlapping sequences. J Neurosci. 2002;22:5760–5768. - PMC - PubMed
    1. Allen TA, Fortin NJ. The evolution of episodic memory. Proc Natl Acad Sci U S A. 2013;110:10379–10386. doi: 10.1073/pnas.1301199110. - DOI - PMC - PubMed
    1. Allen TA, Morris AM, Mattfeld AT, Stark CE, Fortin NJ. A sequence of events model of episodic memory shows parallels in rats and humans. Hippocampus. 2014;24:1178–1188. doi: 10.1002/hipo.22301. - DOI - PMC - PubMed
    1. Allen TA, Morris AM, Stark SM, Fortin NJ, Stark CE. Memory for sequences of events impaired in typical aging. Learn Mem. 2015;22:138–148. doi: 10.1101/lm.036301.114. - DOI - PMC - PubMed
    1. Boucquey VK, Allen TA, Huffman D, Fortin NJ, Stark CE. Memory for sequences of events shows bilateral hippocampal and medial prefrontal cortical activity in humans. Soc Neurosci Abstr. 2014;40:646.04.