. 2016:2016:7568287.
doi: 10.1155/2016/7568287. Epub 2015 Dec 30.

Cell Line-Dependent Variability of Coordinate Expression of p75NTR and CRABP1 and Modulation of Effects of Fenretinide on Neuroblastoma Cells

Affiliations

Cell Line-Dependent Variability of Coordinate Expression of p75NTR and CRABP1 and Modulation of Effects of Fenretinide on Neuroblastoma Cells

Yaoli Pu Yang et al. Oxid Med Cell Longev. 2016.

Abstract

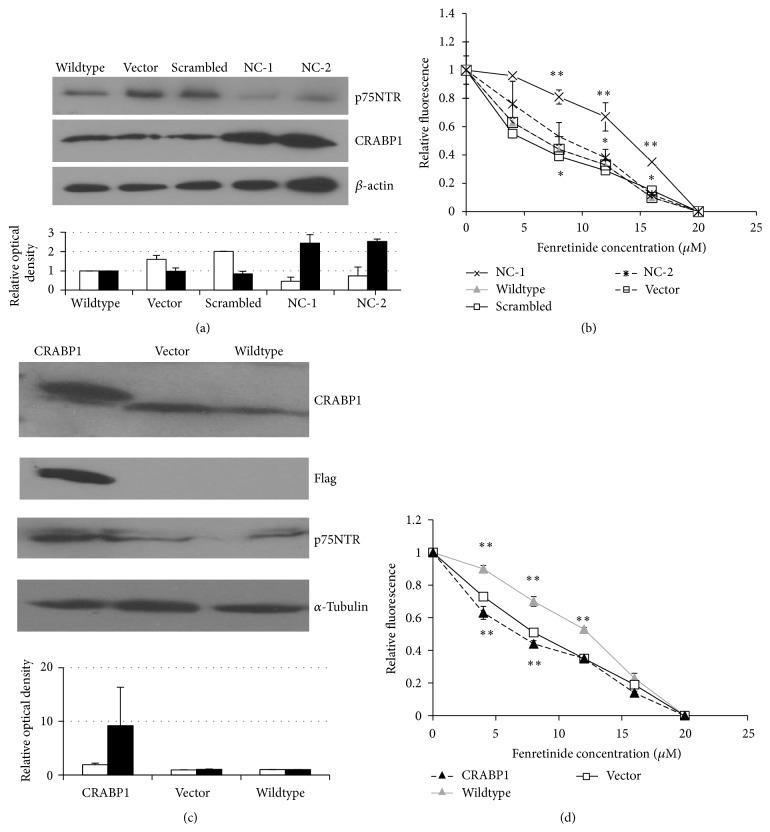
Neuroblastoma is a childhood neural crest tumor. Fenretinide, a retinoic acid analogue, induces accumulation of mitochondrial reactive oxygen species and consequent apoptosis in neuroblastoma cells. The p75 neurotrophin receptor (p75NTR) enhances the antineuroblastoma cell efficacy of fenretinide in vitro. We examined the role of the retinoid binding protein, CRABP1, in p75NTR-mediated potentiation of the efficacy of fenretinide. Knockdown and overexpression, respectively, of either p75NTR or CRABP1 were effected in neuroblastoma cell lines using standard techniques. Expression was determined by qRT-PCR and confirmed at the protein level by Western blot. Metabolic viability was determined by Alamar blue assay. While protein content of CRABP1 correlated roughly with that of p75NTR in the three neuroblastoid or epithelioid human neuroblastoma cell lines studied, manipulation of p75NTR expression resulted in cell line-dependent, variable change in CRABP1 expression. Furthermore, in some cell lines, induced expression of CRABP1 in the absence of p75NTR did not alter cell sensitivity to fenretinide treatment. The effects of manipulation of p75NTR expression on CRABP1 expression and the effects of CRABP1 expression on fenretinide efficacy are therefore neuroblastoma cell line-dependent. Potentiation of the antineuroblastoma cell effects of fenretinide by p75NTR is not mediated solely through CRABP1.


Figures

Figure 1
Figure 1
Western blot (a) and RT-PCR (b) for p75NTR, CRABP1, and loading marker protein and mRNA, respectively, performed on lysates of different neuroblastoma cell lines. Representative blots of 3 performed for each are shown, along with the mean and SEM relative to β-actin from three Western blots (a). hHPRT: human hypoxanthine-guanine phosphoribosyltransferase; open bars, p75NTR; solid bars, CRABP1.
Figure 2
Figure 2
(a) Western blot for CRABP1 in SH-EP1 cells transfected with an expression construct for p75NTR (OE) or the analogous empty vector (OE Ctrl). Staining for α-tubulin serves as a loading control. The graph below the blot depicts mean optical density and SEM (n = 3) of each band relative to the optical density of the corresponding band for α-tubulin and normalized to OE Ctrl = 1.00. (b) qRT-PCR for CRABP1 performed on lysates from OE and OE Ctrl SH-EP1 cells (n = 3 independent samples each) demonstrates the overexpression of CRABP1 in OE cells relative to OE Ctrl cells (∗∗ P < 0.01, Student's t-test). (c) Transient knockdown of p75NTR with siRNA in SH-EP1 cells demonstrates coordinate regulation of p75NTR and CRABP1 expression (Western blot; β-actin serves as a loading control). The graph on the right of the blot depicts mean optical density and SEM (n = 3) of each band relative to the optical density of the corresponding band for β-actin and normalized to control = 1.00.
Figure 3
Figure 3
Metabolic viability and cell number of SH-EP1 cells transfected with CRABP1 siRNA or a scrambled control construct after treatment with fenretinide. (a) Alamar blue assay performed 60 h after treatment with fenretinide. Metabolic viability differs between CRABP1 knockdown (□) and scrambled control construct-transfected (■) cells ( P < 0.05) at 4, 10, and 13 μM fenretinide. Note that Alamar blue assay does not account for cells already lost to apoptosis at the time of assay. A representative Western blot shows CRABP1 and β-actin proteins in Wildtype (WT), scrambled construct-treated (SC), and CRABP1 siRNA-treated (siRNA) cells. The graph below the blot depicts the mean optical density and SEM for 3 blots performed. (b) Representative photomicrographs (10x) of untreated and fenretinide-treated (13 μM) CRABP1 knockdown, mock- (empty vector) transfected, and scrambled control construct-transfected SH-EP1 cells. As depicted in the graph, mock- and scrambled construct-treated cells showed greater cell loss (P < 0.001, Student's t-test; n = 3 determinations) than CRABP1 knockdown cells after fenretinide treatment. The three cell lines demonstrated equivalent cell culture growth and survival under control conditions. (c) Alamar blue metabolic viability assay demonstrates equivalent cell culture growth and redox reserve for the three cell lines under control conditions (NS: no statistically significant difference).
Figure 4
Figure 4
p75NTR, CRABP1, and response to fenretinide in SK-N-AS neuroblastoma cells. (a) Western blot of lysates from SK-N-AS cells in their native state (Wildtype), stably transfected with empty vector (Vector), a scrambled construct (Scr), or shRNA for p75NTR (clones NC-1 and NC-2). Knockdown of p75NTR is more efficient in NC-1 cells than in NC-2 cells. Blotting for β-actin serves as a loading control. The graph below the blot depicts the mean optical density and SEM for 3 blots performed. Open bars, p75NTR; solid bars, CRABP1 (b) Alamar blue assay of SK-N-AS cells treated as in (a) after treatment with fenretinide (n = 3 for each point; results for NC-1 (×, solid line; concentration required for growth inhibition by 50% [GI50] = 15) differ from those for Wildtype (gray triangle; GI50 = 7.5), Vector (□, solid line; GI50 = 5), and Scr (□, dashed line; GI50 = 6) with ∗∗ P < 0.01 and from those for NC-2 (×, dashed line; GI50 = 10) with P < 0.05; Student's t-test). Note that while NC-1 cells are more resistant to fenretinide than empty vector- and scrambled construct-transfected cells, NC-2 cells are not. Western blot (c) and Alamar blue assay (d) of SK-N-AS cells transfected with an expression construct for CRABP1 (CRABP1 (black triangle)) or an empty vector (Vector (□)) or examined in their native state (Wildtype (gray triangle)). Results for Wildtype differ from those for Vector (GI50(Wildtype)/GI50(Vector) = 1.5; ∗∗ P < 0.01), indicating that transfection with an empty construct changes the fenretinide sensitivity of the cells; CRABP1 cells differ from Vector cells (GI50(CRABP1)/GI50(Vector) = 0.8; ∗∗ P < 0.01) at 4 and 8 μM fenretinide. The top band detected with anti-CRABP1 antibody in the CRABP1 lane is from Flag-CRABP1, the expression of which is induced. The graph below the blot depicts the mean optical density and SEM for 3 blots performed. Expression of p75NTR does not change significantly with induction of altered total expression of CRABP1 (Flag-CRABP1 + CRABP1). α-Tubulin is used as a loading control for Western blotting. Open bars, p75NTR; solid bars, CRABP1.
Figure 5
Figure 5
Western blot (a) and Alamar blue assay (b) of SH-SY5Y cells transfected with an expression construct for CRABP1 (CRABP1 OE (black triangle)) or an empty vector (Vector (□)) or examined in their native state (Wildtype (gray triangle)). Results for CRABP1 OE differ from those for Vector and Wildtype (GI50(CRABP1)/GI50(Vector) = 2; GI50(CRABP1)/GI50(Wildtype) = 2; P = 0.05) at 8 and 12 μM fenretinide. β-Actin is used as a loading control for Western blotting.

Similar articles

References

    1. Espinet C., Gonzalo H., Fleitas C., Menal M. J., Egea J. Oxidative stress and neurodegenerative diseases: a neurotrophic approach. Current Drug Targets. 2015;16(1):20–30. doi: 10.2174/1389450116666150107153233. - DOI - PubMed
    1. Parkhurst C. N., Zampieri N., Chao M. V. Nuclear localization of the p75 neurotrophin receptor intracellular domain. Journal of Biological Chemistry. 2010;285(8):5361–5368. doi: 10.1074/jbc.m109.045054. - DOI - PMC - PubMed
    1. Tyurina Y. Y., Nylander K. D., Mirnics Z. K., et al. The intracellular domain of p75NTR as a determinant of cellular reducing potential and response to oxidant stress. Aging Cell. 2005;4(4):187–196. doi: 10.1111/j.1474-9726.2005.00160.x. - DOI - PubMed
    1. Yan C., Mirnics Z. K., Portugal C. F., et al. Cholesterol biosynthesis and the pro-apoptotic effects of the p75 nerve growth factor receptor. Molecular Brain Research. 2005;139:225–234. - PubMed
    1. Ganeshan V., Ashton J., Schor N. F. P75NTR: an enhancer of fenretinide toxicity in neuroblastoma. Cancer Chemotherapy and Pharmacology. 2013;71(3):777–787. doi: 10.1007/s00280-013-2071-7. - DOI - PMC - PubMed

Publication types

MeSH terms