

Iberian red deer: paraphyletic nature at mtDNA but nuclear markers support its genetic identity
- PMID: 26843924
- PMCID: PMC4729781
- DOI: 10.1002/ece3.1836
Iberian red deer: paraphyletic nature at mtDNA but nuclear markers support its genetic identity
Abstract
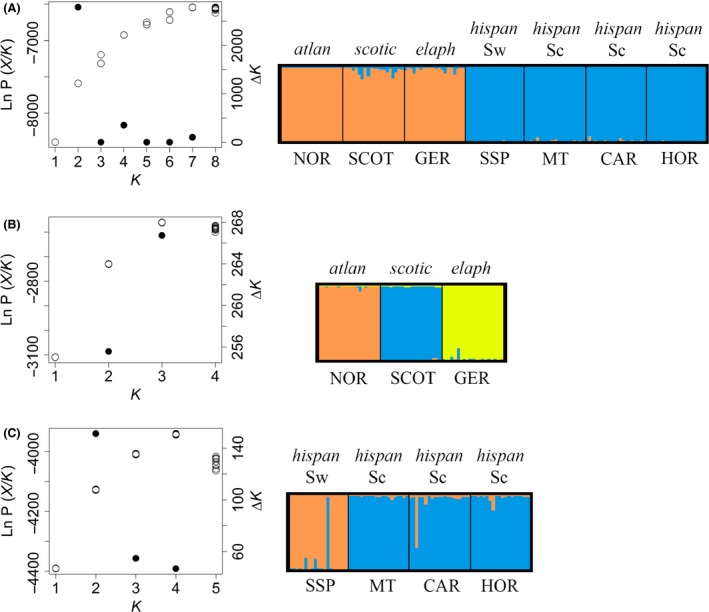
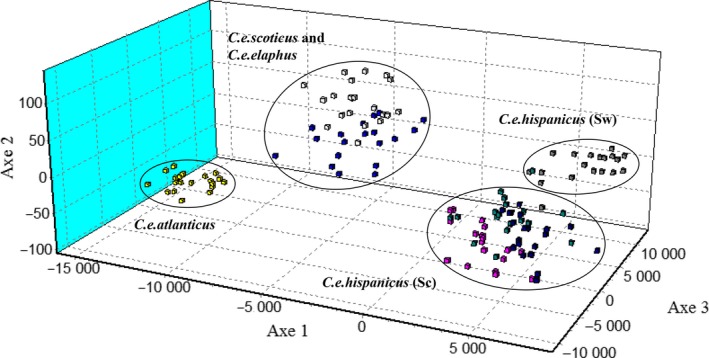
Red deer populations in the Iberian glacial refugium were the main source for postglacial recolonization and subspecific radiation in north-western Europe. However, the phylogenetic history of Iberian red deer (Cervus elaphus hispanicus) and its relationships with northern European populations remain uncertain. Here, we study DNA sequences at the mitochondrial control region along with STR markers for over 680 specimens from all the main red deer populations in Spain and other west European areas. Our results from mitochondrial and genomic DNA show contrasting patterns, likely related to the nature of these types of DNA markers and their specific processes of change over time. The results, taken together, bring support to two distinct, cryptic maternal lineages for Iberian red deer that predated the last glacial maximum and that have maintained geographically well differentiated until present. Haplotype relationships show that only one of them contributed to the northern postglacial recolonization. However, allele frequencies of nuclear markers evidenced one main differentiation between Iberian and northern European subspecies although also supported the structure of both matrilines within Iberia. Thus, our findings reveal a paraphyletic nature for Iberian red deer but also its genetic identity and differentiation with respect to northern subspecies. Finally, we suggest that maintaining the singularity of Iberian red deer requires preventing not only restocking practices with red deer specimens belonging to other European populations but also translocations between both Iberian lineages.
Keywords: Cervus elaphus hispanicus; Iberian glacial refugia; conservation genetics; paraphyletic taxa; phylogeny; phylogeography.
Figures


Similar articles
-
Red deer in Iberia: Molecular ecological studies in a southern refugium and inferences on European postglacial colonization history.PLoS One. 2019 Jan 8;14(1):e0210282. doi: 10.1371/journal.pone.0210282. eCollection 2019. PLoS One. 2019. PMID: 30620758 Free PMC article.
-
Late-glacial recolonization and phylogeography of European red deer (Cervus elaphus L.).Mol Ecol. 2013 Sep;22(18):4711-22. doi: 10.1111/mec.12420. Epub 2013 Aug 9. Mol Ecol. 2013. PMID: 23927498
-
Genome-wide SNP assessment of contemporary European red deer genetic structure highlights the distinction of peripheral populations and the main admixture zones in Europe.Mol Ecol. 2024 Sep;33(18):e17508. doi: 10.1111/mec.17508. Epub 2024 Aug 19. Mol Ecol. 2024. PMID: 39161130
-
Admixture of Eastern and Western European Red Deer Lineages as a Result of Postglacial Recolonization of the Czech Republic (Central Europe).J Hered. 2015 Jul-Aug;106(4):375-85. doi: 10.1093/jhered/esv018. Epub 2015 Apr 27. J Hered. 2015. PMID: 25918430
-
The application of reproductive technologies to natural populations of red deer.Reprod Domest Anim. 2006 Oct;41 Suppl 2:93-102. doi: 10.1111/j.1439-0531.2006.00773.x. Reprod Domest Anim. 2006. PMID: 16984473 Review.
Cited by
-
Speciated mechanism in Quaternary cervids (Cervus and Capreolus) on both sides of the Pyrenees: a multidisciplinary approach.Sci Rep. 2022 Nov 23;12(1):20200. doi: 10.1038/s41598-022-24684-7. Sci Rep. 2022. PMID: 36418512 Free PMC article.
-
Genetic Structure and Effective Population Sizes in European Red Deer (Cervus elaphus) at a Continental Scale: Insights from Microsatellite DNA.J Hered. 2016 Jul;107(4):318-26. doi: 10.1093/jhered/esw011. Epub 2016 Feb 24. J Hered. 2016. PMID: 26912909 Free PMC article.
-
Calibration of life history traits with epiphyseal closure, dental eruption and bone histology in captive and wild red deer.J Anat. 2019 Aug;235(2):205-216. doi: 10.1111/joa.13016. Epub 2019 May 30. J Anat. 2019. PMID: 31148188 Free PMC article.
-
Using genetic tools to estimate the prevalence of non-native red deer (Cervus elaphus) in a Western European population.Ecol Evol. 2017 Aug 18;7(19):7650-7660. doi: 10.1002/ece3.3282. eCollection 2017 Oct. Ecol Evol. 2017. PMID: 29043022 Free PMC article.
-
Vocal phenotype of male rutting roars and genetic markers delineate East European red deer (Cervus elaphus) from Central and West European populations.Naturwissenschaften. 2021 Jun 29;108(4):30. doi: 10.1007/s00114-021-01742-0. Naturwissenschaften. 2021. PMID: 34185170
References
-
- Arroyo, J. , Carrión J. S., Hampe A., and Jordano P. 2004. La distribución de las especies a diferentes escalas espacio‐temporales Pp. 27–67 in Valladares F., ed. Ecología del Bosque Mediterráneo en un Mundo Cambiante. Ministerio de Medio Ambiente, EGRAF S.A., Madrid.
-
- Avise, J. C. 2000. Phylogeography: the history and formation of species. Harvard Univ. Press, Cambridge, MA.
-
- Belkhir, K. , Borsa P., Chikhi L., Raufaste N., and Bonhomme F.. 2004. GENETIX 4.05, logiciel sous Windows TM pour la génétique des populations. Laboratoire Génome, Populations, Interactions, CNRS UMR 5171, Université de Montpellier II, Montpellier (France).
-
- Blanco, J. C. 1998. Mamíferos de España. Tomo II. Geo‐Planeta, Barcelona.
LinkOut - more resources
Full Text Sources
Other Literature Sources
