. 2016 Jan 21:4:e1621.
doi: 10.7717/peerj.1621. eCollection 2016.

Cross-platform normalization of microarray and RNA-seq data for machine learning applications

Affiliations

Cross-platform normalization of microarray and RNA-seq data for machine learning applications

Jeffrey A Thompson et al. PeerJ. .

Abstract

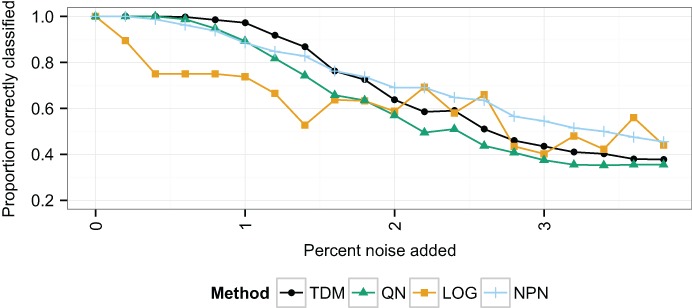
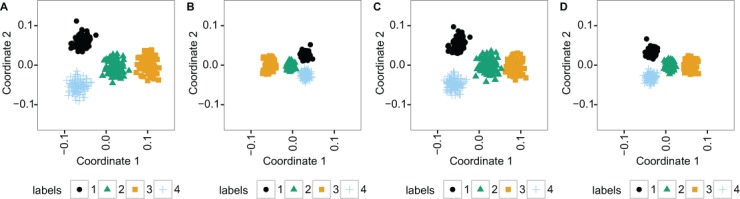
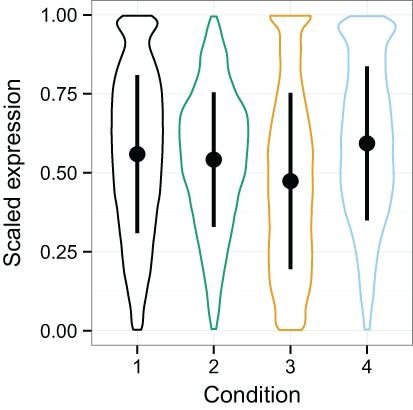
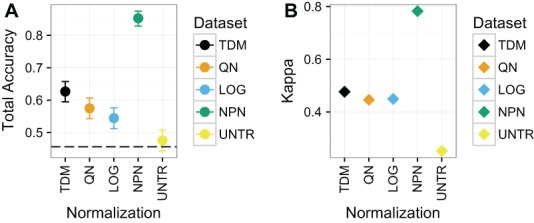
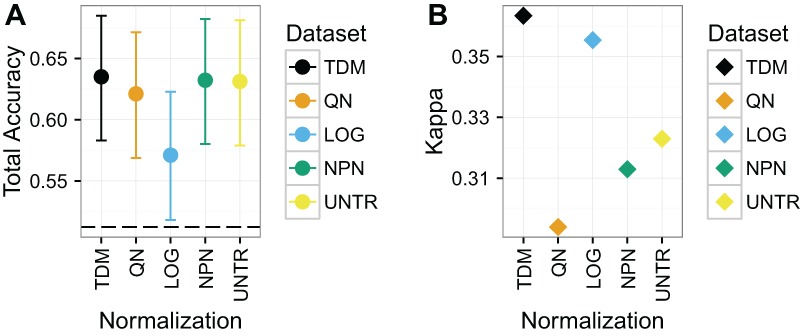
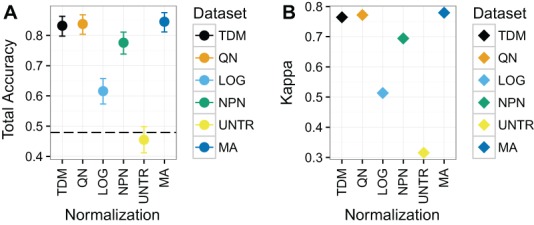
Large, publicly available gene expression datasets are often analyzed with the aid of machine learning algorithms. Although RNA-seq is increasingly the technology of choice, a wealth of expression data already exist in the form of microarray data. If machine learning models built from legacy data can be applied to RNA-seq data, larger, more diverse training datasets can be created and validation can be performed on newly generated data. We developed Training Distribution Matching (TDM), which transforms RNA-seq data for use with models constructed from legacy platforms. We evaluated TDM, as well as quantile normalization, nonparanormal transformation, and a simple log 2 transformation, on both simulated and biological datasets of gene expression. Our evaluation included both supervised and unsupervised machine learning approaches. We found that TDM exhibited consistently strong performance across settings and that quantile normalization also performed well in many circumstances. We also provide a TDM package for the R programming language.

Keywords: Cross-platform normalization; Distribution; Gene expression; Machine learning; Microarray; Nonparanormal transformation; Normalization; Quantile normalization; RNA-sequencing; Training.


Conflict of interest statement

The authors declare that they have no competing interests.

Figures

Figure 1
Figure 1. The proportion of samples correctly classified in the simulated data at increasing levels of noise.
This is taken to be the proportion of samples clustered in a group for which the most common class matches their own. The x-axis represents increasing noise in the data. As the noise increases, the TDM transformed data initially have the best performance, but past 2% noise, log2 and nonparanormal transformation obtain better classification.
Figure 2
Figure 2. The two principal coordinates of simulated data at 1.8% noise level are slightly better separated into four clusters following TDM normalization than using the other methods.
(A) TDM normalization (B) log2 transformation (C) quantile normalization (D) nonparanormal transformation.
Figure 3
Figure 3. Violin plots of the simulated data distributions with standard deviation superimposed.
These plots show the distribution of expression values for the samples with each particular condition. Within and between class variability were created in the initial simulated dataset to create a challenging problem for normalization. This complication is amplified as noise is added.
Figure 4
Figure 4. Results for Dataset 1.
(A) Mean total accuracy for BRCA subtype classification across ten iterations with 95% confidence intervals. Dashed line represents the “no information rate” that could be achieved by always picking the most common class. NPN had the highest mean total accuracy on these data, followed by TDM, then quantile normalization, and log2 transformation respectively. The untransformed RNA-seq data performed the worst. (B) Mean Kappa for BRCA subtype classification across ten iterations. NPN had the highest mean Kappa on these data, followed by TDM, which was then followed by quantile normalization and log2 transformation. The untransformed RNA-seq data performed the worst.
Figure 5
Figure 5. Results for Dataset 2.
(A) Mean total accuracy for colon/rectal cancer CIMP classification across ten iterations with 95% confidence intervals. Dashed line represents the “no information rate” that could be achieved by always picking the most common class. TDM had the highest mean total accuracy, although it was only slightly better than nonparanormal transformation or even the untransformed RNA-seq data. (B) TDM’s mean Kappa for colon/rectal cancer CIMP classification across ten iterations was higher than that achieved by any other method, although it was closely followed by log2 transformation.
Figure 6
Figure 6. Results for Dataset 3 containing METABRIC microarray training data and TCGA RNA-seq test data (TDM, QN, LOG, NPN, UNTR) as well as TCGA microarray data for comparison (MA).
(A) Mean total accuracy for BRCA subtype classification across ten iterations. 95% confidence intervals shown. TDM and quantile normalization had the highest mean total accuracy for the normalized RNA-seq data when tested using a model trained on METABRIC. In fact, they were only slightly worse than actual microarray data from TCGA using the same samples. Nonparanormal transformation had the next best performance, while log2 transformation performed markedly worse. The untransformed data accuracy was actually lower than the no information rate. (B) Mean Kappa for BRCA subtype classification across ten iterations using TDM and quantile normalization achieved a high Kappa when tested using a model trained on METABRIC. They performed similarly to the TCGA microarray data (MA) that was assayed on the same samples.

Similar articles

Cited by

References

    1. Atak ZK, Gianfelici V, Hulselmans G, De Keersmaecker K, Devasia AG, Geerdens E, Mentens N, Chiaretti S, Durinck K, Uyttebroeck A, Vandenberghe P, Wlodarska I, Cloos J, Foà R, Speleman F, Cools J, Aerts S. Comprehensive analysis of transcriptome variation uncovers known and novel driver events in t-cell acute lymphoblastic leukemia. PLoS Genetics. 2013;9(12):e1621. doi: 10.1371/journal.pgen.1003997. - DOI - PMC - PubMed
    1. Bolstad BM. Preprocesscore: A Collection of Pre-Processing Functions. (R package version 1.30.0) 2015
    1. Bolstad BM, Irizarry RA, Astrand M, Speed TP. A comparison of normalization methods for high density oligonucleotide array data based on variance and bias. Bioinformatics. 2003;19(2):185–193. doi: 10.1093/bioinformatics/19.2.185. - DOI - PubMed
    1. Cancer Genome Atlas Network. Comprehensive molecular portraits of human breast tumours. Nature. 2012;490(7418):61–70. doi: 10.1038/nature11412. - DOI - PMC - PubMed
    1. Curtis C, Shah SP, Chin S-F, Turashvili G, Rueda OM, Dunning MJ, Speed D, Lynch AG, Samarajiwa S, Yuan Y, Gräf S, Ha G, Haffari G, Bashashati A, Russell R, McKinney S, METABRIC Group. Langerød A, Green A, Provenzano E, Wishart G, Pinder S, Watson P, Markowetz F, Murphy L, Ellis I, Purushotham A, Børresen-Dale AL-L, Brenton JD, Tavaré S, Caldas C, Aparicio S. The genomic and transcriptomic architecture of 2,000 breast tumours reveals novel subgroups. Nature. 2012;486(7403):346–352. doi: 10.1038/nature10983. - DOI - PMC - PubMed