

Corticosterone exposure augments sensitivity to the behavioral and neuroplastic effects of fluoxetine in C57BL/6 mice
- PMID: 26844246
- PMCID: PMC4730790
- DOI: 10.1016/j.ynstr.2015.12.005
Corticosterone exposure augments sensitivity to the behavioral and neuroplastic effects of fluoxetine in C57BL/6 mice
Abstract
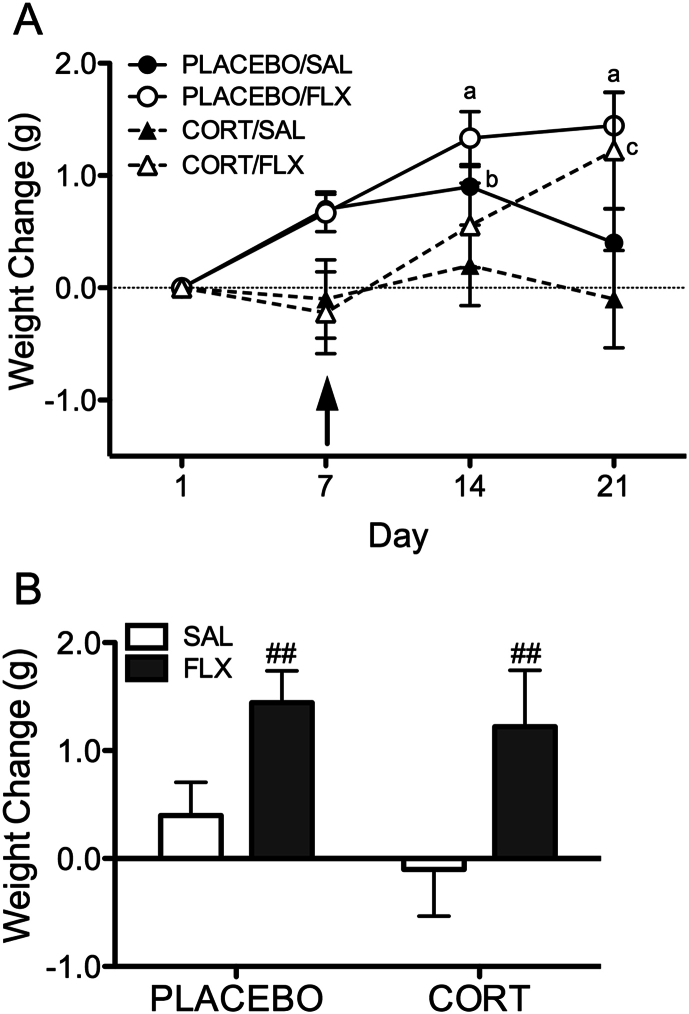
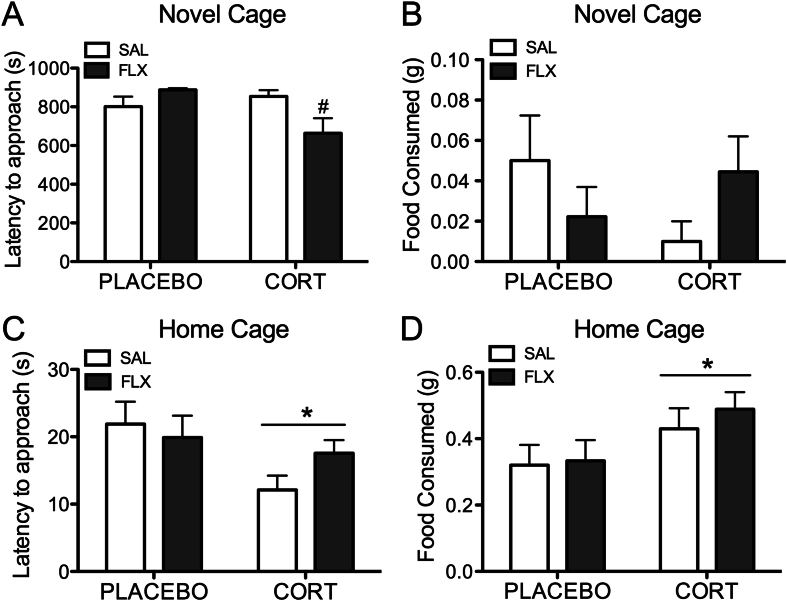
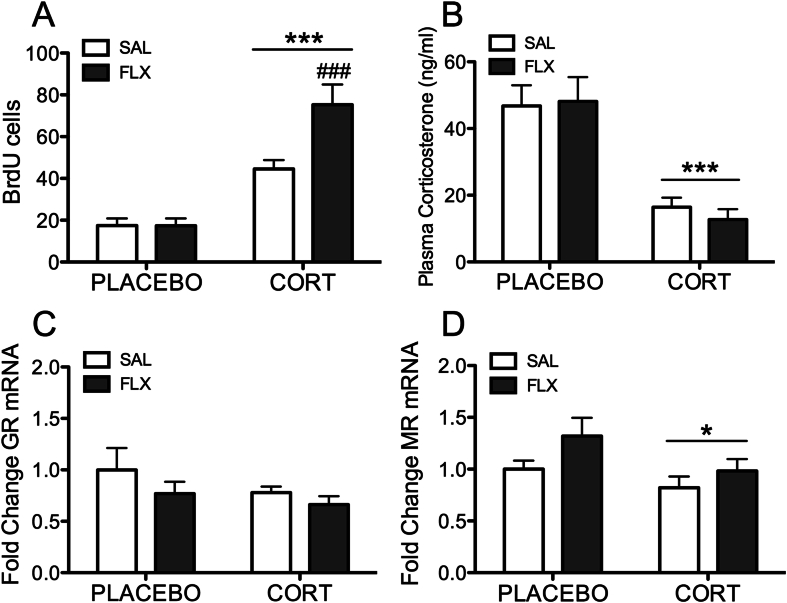
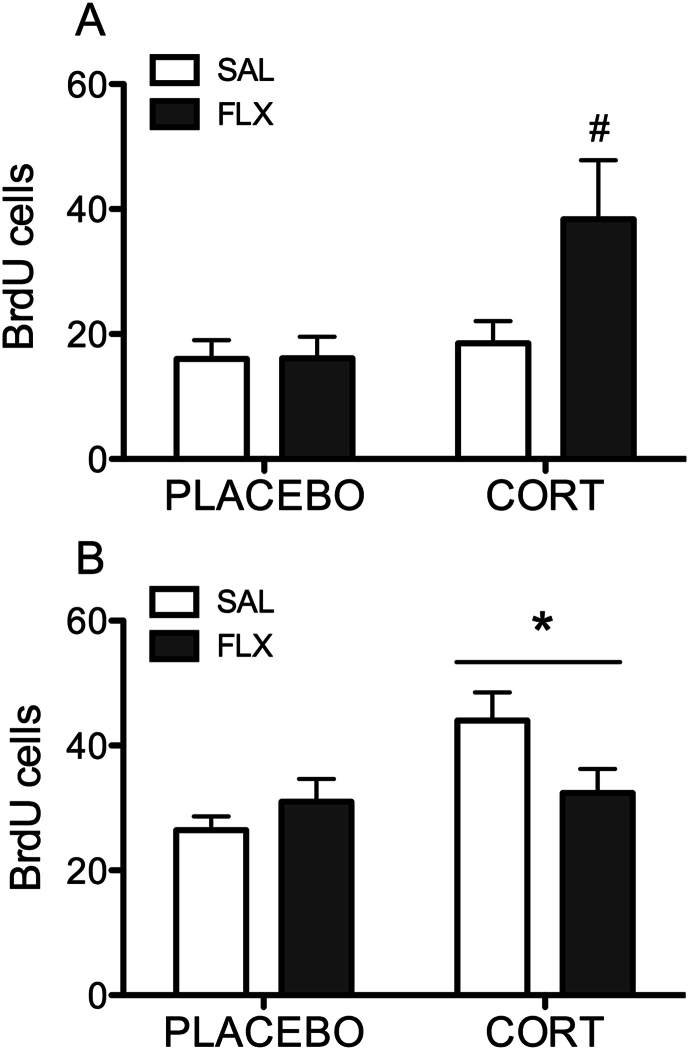
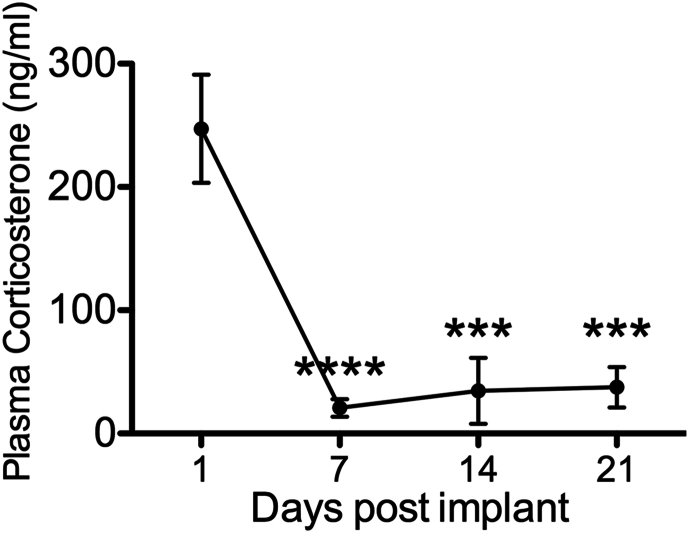
Both genetic background and pre-existing stress play critical roles in the effects of antidepressant drugs. The current studies showed this principal by demonstrating that exposure to the stress hormone corticosterone (CORT) allowed behavioral and neurogenic effects to emerge following chronic treatment with fluoxetine of C57BL/6 mice, a strain ordinarily resistant to these effects. Adult male mice were implanted subcutaneously with 21-day slow-release CORT pellets (10 mg) or placebo and then co-treated with 5 mg/kg fluoxetine (b.i.d., i.p.) or saline for 14 days. Animals were then assessed for approach behavior in the novelty-induced hypophagia (NIH) test, hippocampal cell proliferation, corticosteroid receptor expression, and CORT plasma levels. Co-treatment of CORT with fluoxetine significantly reduced approach behavior in the novel environment of the NIH test and increased hippocampal cell proliferation whereas fluoxetine given alone was ineffective. CORT given alone did not alter approach behavior in the novel environment and caused a smaller increase of cell proliferation. The CORT effect was blocked by adrenalectomy and was likely due to increased adrenal feedback. Cell proliferation in CORT-treated animals was associated with reduced mineralocorticoid, but not glucocorticoid, receptor mRNA expression. Although the pellets were advertised to release CORT for 21 days, plasma CORT levels were increased at 1 day after implantation but were not sustained when measured at 7 days or longer intervals. Nevertheless, the transient CORT increase was sufficient to induce long-lasting behavioral and molecular changes when followed by fluoxetine treatment. These studies warrant further investigation into the role of glucocorticoids and environmental stress as adjunctive facilitators of the response to antidepressants, especially for treatment-resistant patients.
Keywords: Anxiety; Corticosterone; Fluoxetine; Neurogenesis; Stress; Treatment resistance.
Figures
Similar articles
-
Parity modifies the effects of fluoxetine and corticosterone on behavior, stress reactivity, and hippocampal neurogenesis.Neuropharmacology. 2016 Jun;105:443-453. doi: 10.1016/j.neuropharm.2015.11.027. Epub 2016 Jan 22. Neuropharmacology. 2016. PMID: 26808316
-
Strain differences in the effects of chronic corticosterone exposure in the hippocampus.Neuroscience. 2012 Oct 11;222:269-80. doi: 10.1016/j.neuroscience.2012.06.017. Epub 2012 Jun 23. Neuroscience. 2012. PMID: 22735575 Free PMC article.
-
Differential Peripheral Proteomic Biosignature of Fluoxetine Response in a Mouse Model of Anxiety/Depression.Front Cell Neurosci. 2017 Aug 16;11:237. doi: 10.3389/fncel.2017.00237. eCollection 2017. Front Cell Neurosci. 2017. PMID: 28860968 Free PMC article.
-
Maternal postpartum corticosterone and fluoxetine differentially affect adult male and female offspring on anxiety-like behavior, stress reactivity, and hippocampal neurogenesis.Neuropharmacology. 2016 Feb;101:165-78. doi: 10.1016/j.neuropharm.2015.09.001. Epub 2015 Sep 25. Neuropharmacology. 2016. PMID: 26391064
-
S 47445 Produces Antidepressant- and Anxiolytic-Like Effects through Neurogenesis Dependent and Independent Mechanisms.Front Pharmacol. 2017 Jul 19;8:462. doi: 10.3389/fphar.2017.00462. eCollection 2017. Front Pharmacol. 2017. PMID: 28769796 Free PMC article.
Cited by
-
A Neurodevelopmental Model of Combined Pyrethroid and Chronic Stress Exposure.Toxics. 2019 May 2;7(2):24. doi: 10.3390/toxics7020024. Toxics. 2019. PMID: 31052489 Free PMC article.
-
Adiporon, an adiponectin receptor agonist acts as an antidepressant and metabolic regulator in a mouse model of depression.Transl Psychiatry. 2018 Aug 16;8(1):159. doi: 10.1038/s41398-018-0210-y. Transl Psychiatry. 2018. PMID: 30115912 Free PMC article.
-
Corticosterone Induced the Increase of proBDNF in Primary Hippocampal Neurons Via Endoplasmic Reticulum Stress.Neurotox Res. 2020 Aug;38(2):370-384. doi: 10.1007/s12640-020-00201-4. Epub 2020 May 6. Neurotox Res. 2020. PMID: 32378057
-
Combined corticosterone treatment and chronic restraint stress lead to depression associated with early cognitive deficits in mice.Metab Brain Dis. 2018 Apr;33(2):421-431. doi: 10.1007/s11011-017-0148-4. Epub 2017 Dec 3. Metab Brain Dis. 2018. PMID: 29199383
References
-
- Balu D.T., Hodes G.E., Hill T.E., Ho N., Rahman Z., Bender C.N., Ring R.H., Dwyer J.M., Rosenzweig-Lipson S., Hughes Z.A., Schechter L.E., Lucki I. Flow cytometric analysis of BrdU incorporation as a high-throughput method for measuring adult neurogenesis in the mouse. J. Pharmacol. Toxicol. Methods. 2009;59:100–107. - PMC - PubMed
-
- Bechtholt A.J., Hill T.E., Lucki I. Anxiolytic effect of serotonin depletion in the novelty-induced hypophagia test. Psychopharmacology. 2007;190:531–540. - PubMed
Grants and funding
LinkOut - more resources
Full Text Sources
Other Literature Sources
