. 2015 Nov 24;2(12):2070-9.
doi: 10.1016/j.ebiom.2015.11.034. eCollection 2015 Dec.

Analysis of B Cell Repertoire Dynamics Following Hepatitis B Vaccination in Humans, and Enrichment of Vaccine-specific Antibody Sequences

Affiliations

Analysis of B Cell Repertoire Dynamics Following Hepatitis B Vaccination in Humans, and Enrichment of Vaccine-specific Antibody Sequences

Jacob D Galson et al. EBioMedicine. .

Abstract

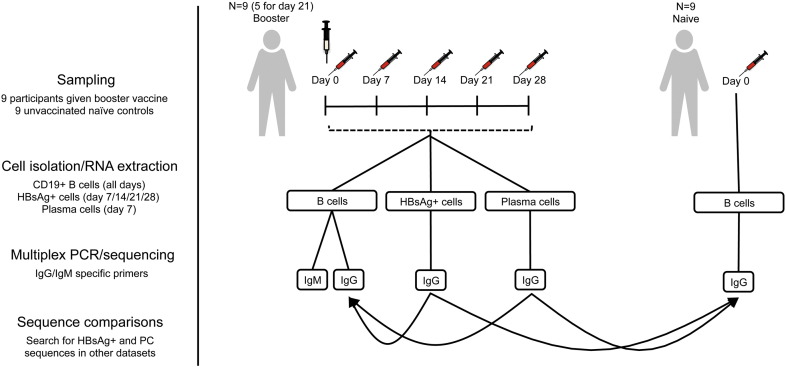
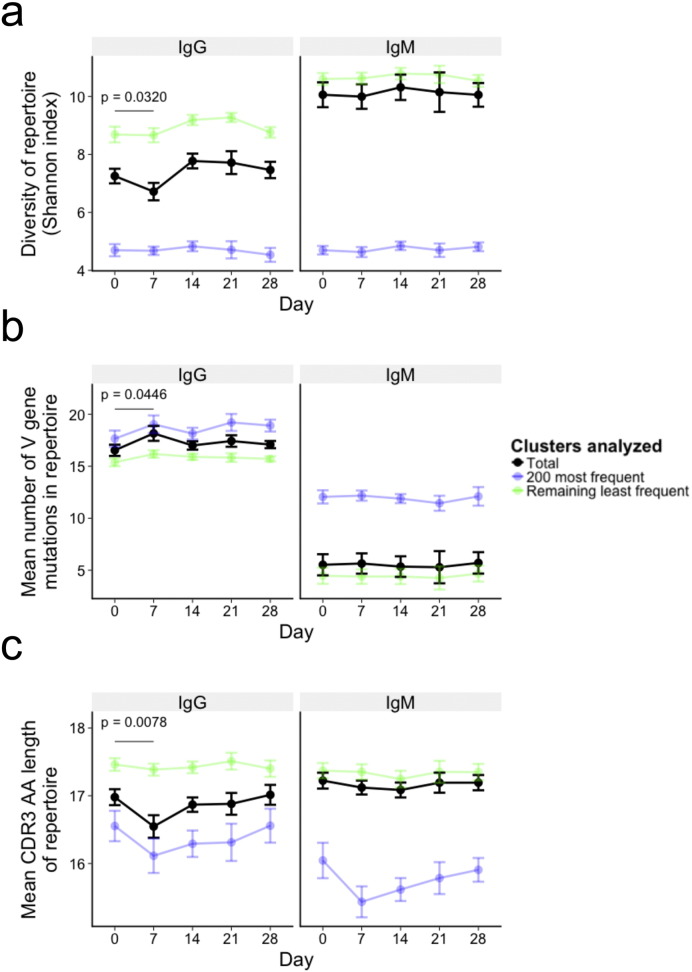
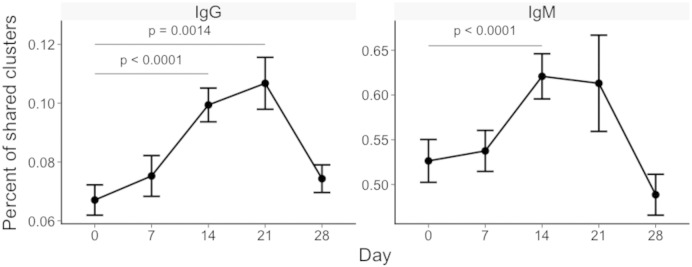
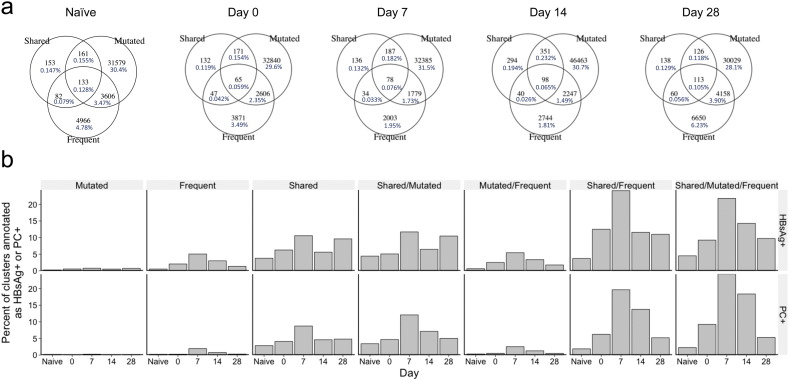
Generating a diverse B cell immunoglobulin repertoire is essential for protection against infection. The repertoire in humans can now be comprehensively measured by high-throughput sequencing. Using hepatitis B vaccination as a model, we determined how the total immunoglobulin sequence repertoire changes following antigen exposure in humans, and compared this to sequences from vaccine-specific sorted cells. Clonal sequence expansions were seen 7 days after vaccination, which correlated with vaccine-specific plasma cell numbers. These expansions caused an increase in mutation, and a decrease in diversity and complementarity-determining region 3 sequence length in the repertoire. We also saw an increase in sequence convergence between participants 14 and 21 days after vaccination, coinciding with an increase of vaccine-specific memory cells. These features allowed development of a model for in silico enrichment of vaccine-specific sequences from the total repertoire. Identifying antigen-specific sequences from total repertoire data could aid our understanding B cell driven immunity, and be used for disease diagnostics and vaccine evaluation.

Keywords: B cell repertoire; Immunoglobulin repertoire; Vaccination; mAbs.


Figures

Fig. 1
Fig. 1
Study design. Two groups of participants were enrolled into the study: one group of nine participants with no previous HepB vaccine history (naïve group), and one group of nine participants who had previously received a course of HepB vaccine (booster vaccine group). In the naïve group, total B cells were sorted and sequenced (IgG transcripts only) at a single timepoint. In the booster vaccine group, total B cells were sorted and sequenced (IgG and IgM transcripts) on the day of HepB booster vaccine, and on days 7, 14, 21 (samples missing from 4 participants), and 28 following vaccination. In addition, for 5 of the participants in this group, HBsAg + B cells were isolated and sequenced on days 7, 14, 21 and 28 following vaccination, and PCs on day 7 following vaccination. Sequences from the HBsAg + sorted cells, and sorted PCs were used to find sequence clusters in the total repertoire of both the vaccinated and naïve group that appeared to have enriched specificity towards the vaccine.
Fig. 2
Fig. 2
Clinical measures of vaccine response. (a) Anti-HBs antibody concentrations of each participant at day 0 and day 28 following vaccination. (b) Kinetics of HBsAg-specific memory cells and PC numbers during the study period determined by ELISpot. Input cells are PBMC's for the PC detection assay, and cultured lymphocytes for the memory cell detection assay. (c & d) Same as a and b, but displaying mean values ± SEM of the nine participants. (e) Correlation between HBsAg-specific PC numbers at day 7, and HBsAg-specific memory cell numbers at day 28. (f) Correlation between HBsAg-specific PC numbers at day 7, and the absolute increase in antibody concentration between day 0 and 28. For e and f, rho represents Spearman's rank correlation coefficient.
Fig. 3
Fig. 3
Day 7 repertoire expansions. (a) Histogram of the most frequent 1000 clusters ordered by frequency. Bars represent mean values of samples from all 41 samples. Vertical lines cross the x-axis at cluster number 200, and horizontal lines cross the y-axis at 0.1% (representing clusters containing 100 sequences). (b) Representative cluster kinetics plot from participant 1066 for their IgG repertoire (see Fig. S2 for plots from all participants). The 200 most frequent clusters at each day were found for this participant, and the frequencies of these clusters were plotted as a stacked bar chart, centered to the middle of the y-axis at each day. Clusters from each day were then joined using a horizontal stream to illustrate how the frequency of the clusters changes over time. The width and darkness of the stream represents the frequency of the cluster at that time. (c) Mean percent of the total repertoire comprised by the top 200 most frequent clusters at each day. Error bars indicate ± SEM from 8 participants. P value represents the result from a t-test. (d) Correlation between day 7 PC numbers, and the fold change in the number of clusters present at a frequency greater than 0.1%. r represents the Pearson product–moment correlation coefficient.
Fig. 4
Fig. 4
Expansion-induced changes in diversity, mutation, and CDR3 AA length. Changes in mean repertoire diversity (measured using Shannon's index with each cluster considered a distinct species) (a), mean number of V gene mutations from all sequences in the repertoire (b), and mean CDR3 AA sequence length from all sequences in the repertoire (c). Mean ± SEM shown for 8 participants; black points are values from the total repertoire, green are from sequences contained within the 200 most frequent clusters from that sample, and blue are from the remaining clusters. P value represents the result from a t-test comparing day 0 and day 7 values from the total repertoire.
Fig. 5
Fig. 5
Repertoire convergence. At each day, the percent of clusters shared by each pair of two participants was determined (8 participants, giving 28 different pairings). Shown are the mean values ± SEM of the percent of clusters shared between each pair. Percent is calculated as (A ∩ B/sum(A,B) ∗ 100. P values represents the result from a t-test comparing day 0 and day 7 values from the total repertoire.
Fig. 6
Fig. 6
Kinetics of antigen-specific clusters. (a) FACS gating strategy for isolating HBsAg + B cells and PCs from CD19 + enriched cells. (b) Results from competition experiment where unconjugated HBsAg was added to the antibody mix at the same time as the HBsAg-APC. Mean and ± SEM shown for three tests of each condition. (c) Of the 1360 total clusters annotated as HBsAg + based on the sequence data from sorted cells, the number of these in each participant at each day was determined, and expressed as a percentage of the total number of clusters present in that participant at that day. In addition, a random sample of 1360 clusters was also taken from the dataset, and the same calculation done as a control. (d) Percent of the total repertoire comprised by the clusters identified in a (ie, corrected for cluster size). (e & f) show the same as c & d, but with the 289 clusters annotated as PC +. (g & h) show the same as c & d, but with the 65 clusters identified in our dataset that matched to previously described sequences specific for either TT or influenza. For all plots, horizontal bars show the median value from either the 8 vaccinated participants or the 9 naïve participants.
Fig. 7
Fig. 7
Bioinformatic enrichment of vaccine-specific clusters from the total repertoire. (a) Venn diagrams showing the overlap in the number of the shared (by more than two participants), mutated (more than 18 V gene mutations on average), and frequent (more than 0.01% of the total repertoire) clusters at each day from the 8 vaccinated participants, and also the 9 naïve participants. Day 21 is omitted, as there were no samples from four of the participants at this timepoint. Percentages are calculated by dividing the number of clusters present in a particular category by the total number of clusters at that timepoint. (b) In each category in the Venn diagrams, the percent of the sequences that were annotated as HBsAg + or PC + based on the FACS data was determined.

References

    1. Ademokun A., Wu Y.-C., Martin V. Vaccination-induced changes in human B-cell repertoire and pneumococcal IgM and IgA antibody at different ages. Aging Cell. 2011;10(6):922–930. - PMC - PubMed
    1. Bachmann M.F., Odermatt B., Hengartner H. Induction of long-lived germinal centers associated with persisting antigen after viral infection. J. Exp. Med. 1996;183(5):2259–2269. - PMC - PubMed
    1. Blanchard-Rohner G., Pulickal A.S., Jol-van der Zijde C.M. Appearance of peripheral blood plasma cells and memory B cells in a primary and secondary immune response in humans. Blood. 2009;114(24):4998–5002. - PMC - PubMed
    1. Boyd S.D., Marshall E.L., Merker J.D. Measurement and clinical monitoring of human lymphocyte clonality by massively parallel V-D-J pyrosequencing. Sci. Transl. Med. 2009;1(12):12ra23. - PMC - PubMed
    1. Brochet X., Lefranc M.-P., Giudicelli V. IMGT/V-QUEST: the highly customized and integrated system for IG and TR standardized V-J and V-D-J sequence analysis. Nucleic Acids Res. 2008;36(Web Server issue):W503–W508. - PMC - PubMed

Publication types

MeSH terms