. 2015 Nov 19;2(12):2101-9.
doi: 10.1016/j.ebiom.2015.11.021. eCollection 2015 Dec.

Economics and Outcome After Hematopoietic Stem Cell Transplantation: A Retrospective Cohort Study

Affiliations

Economics and Outcome After Hematopoietic Stem Cell Transplantation: A Retrospective Cohort Study

Alois Gratwohl et al. EBioMedicine. .

Abstract

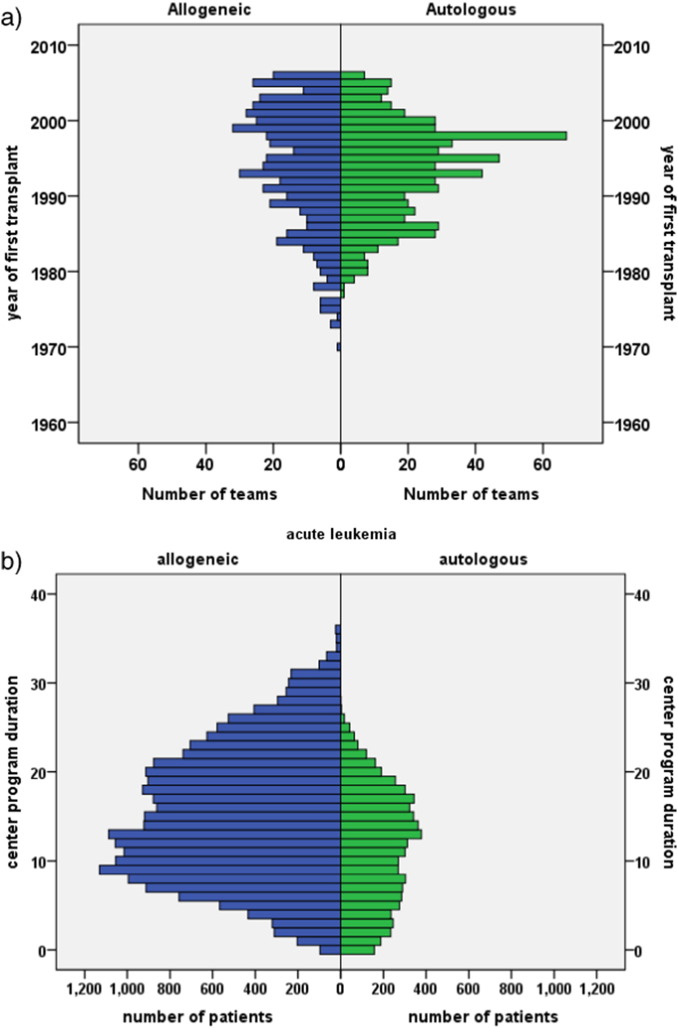
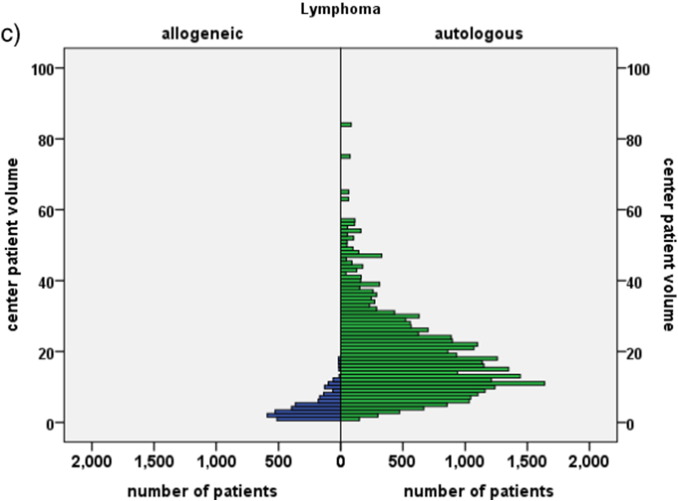
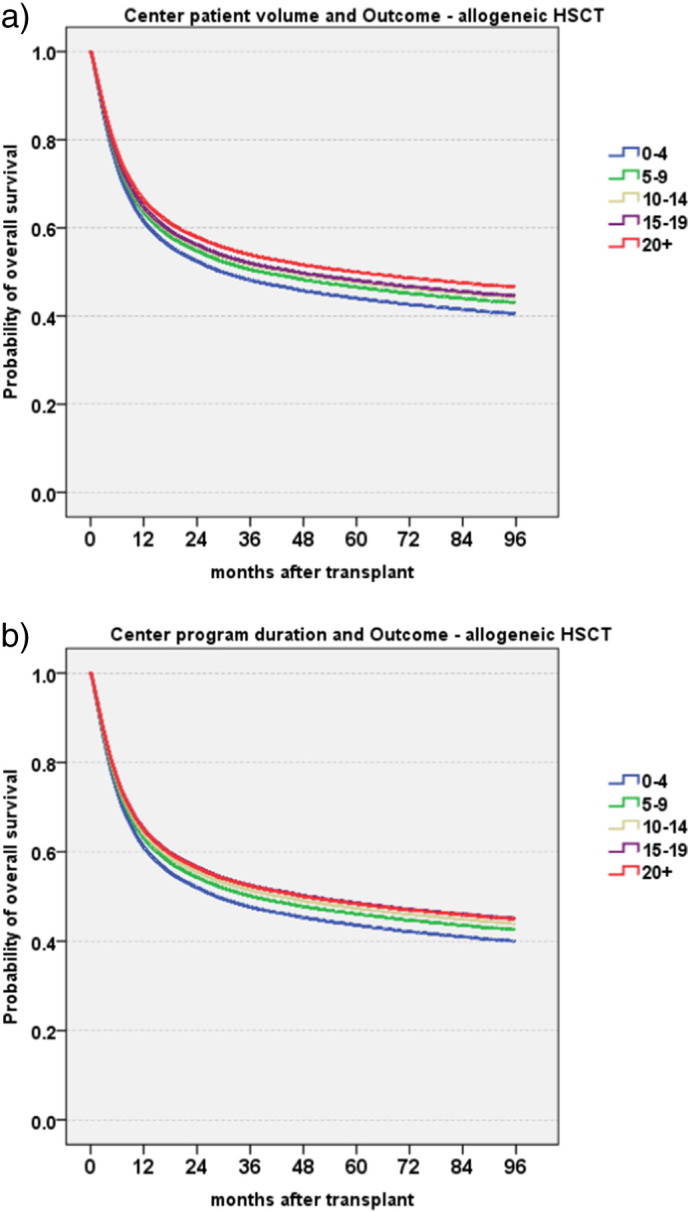
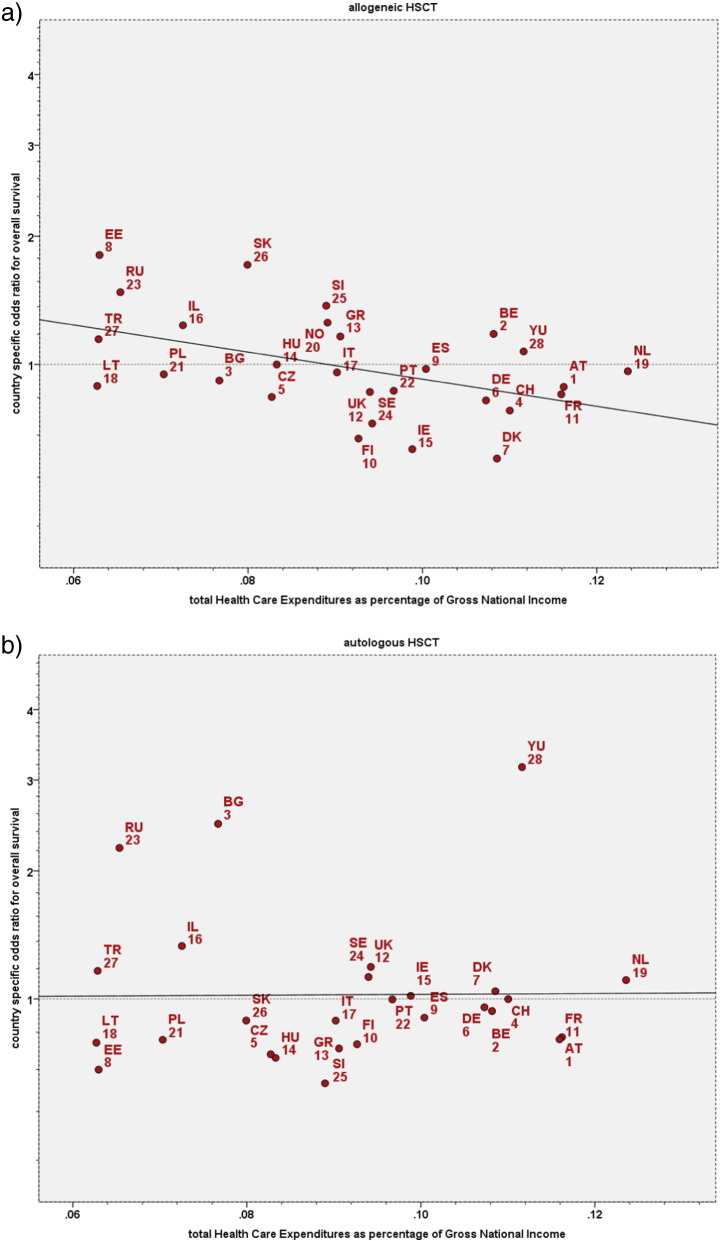
Hematopoietic stem cell transplantation (HSCT) is a lifesaving expensive medical procedure. Hence, more transplants are performed in more affluent countries. The impact of economic factors on patient outcome is less defined. We analyzed retrospectively a defined cohort of 102,549 patients treated with an allogeneic (N = 37,542; 37%) or autologous (N = 65,007; 63%) HSCT. They were transplanted by one of 404 HSCT centers in 25 European countries between 1999 and 2006. We searched for associations between center-specific microeconomic or country-specific macroeconomic factors and outcome. Center patient-volume and center program-duration were significantly and systematically associated with improved survival after allogeneic HSCT (HR 0·87; 0·84-0·91 per 10 patients; p < 0·0001; HR 0·90;0·85-0·90 per 10 years; p < 0·001) and autologous HSCT (HR 0·91;0·87-0·96 per 10 patients; p < 0·001; HR 0·93;0·87-0·99 per 10 years; p = 0·02). The product of Health Care Expenditures by Gross National Income/capita was significantly associated in multivariate analysis with all endpoints (R(2) = 18%; for relapse free survival) after allogeneic HSCT. Data indicate that country- and center-specific economic factors are associated with distinct, significant, systematic, and clinically relevant effects on survival after HSCT. They impact on center expertise in long-term disease and complication management. It is likely that these findings apply to other forms of complex treatments.

Keywords: Center effect; GNI/cap; HCE/cap; HDI; Hematopoietic stem cell transplantation; Macroeconomics; Microeconomics; Outcome; Patient volume; Program duration; Risk assessment; Survival.


Figures

Fig. 1
Fig. 1
Distribution of center program duration and patient volume. The figure depicts the diversity of the patient population and the heterogeneity in center program duration in years and in patient volume according to main disease indication for the 102,549 patients with an allogeneic (N = 37,542; 37%) or autologous (N = 65,007; 63%) hematopoietic stem cell transplant in Europe between 1999 and 2006. a. Program duration. The graph shows the number of teams (frequency) beginning their program to perform allogeneic HSCT (left part, blue) or autologous HSCT (right part, green) by the year of first transplant from 1970 to 2006. b. Disease specific program duration. The graph illustrates numbers of patients (frequency) by treatment modality (allogeneic HSCT, blue; autologous HSCT, green) and a selected main indication (acute leukemia) according to the program duration in years for this indication of their respective transplant team. Note that program duration for allogeneic HSCT was longer than for autologous HSCT, as illustrated above in Fig. 1a; Numbers of allogeneic HSCT for acute leukemia were higher than numbers of autologous HSCT. For other main disease indications, see supplementary Fig. 1. c. Center patient volume. The graph depicts the number of patients (frequency) according to treatment modality (allogeneic HSCT, blue; autologous HSCT, green) and main indication (lymphoma) by the number of patients treated for this disease by their respective transplant team in their respective transplant year. Note that the number of patients transplanted with an allogeneic HSCT is much lower than the number of patients transplanted with an autologous HSCT for this indication; that fewer centers performed allogeneic HSCT for this indication and with lower patient numbers. For other main disease indications, see supplementary Fig. 1. (For interpretation of the references to color in this figure legend, the reader is referred to the web version of this article.)
Fig. 1
Fig. 1
Distribution of center program duration and patient volume. The figure depicts the diversity of the patient population and the heterogeneity in center program duration in years and in patient volume according to main disease indication for the 102,549 patients with an allogeneic (N = 37,542; 37%) or autologous (N = 65,007; 63%) hematopoietic stem cell transplant in Europe between 1999 and 2006. a. Program duration. The graph shows the number of teams (frequency) beginning their program to perform allogeneic HSCT (left part, blue) or autologous HSCT (right part, green) by the year of first transplant from 1970 to 2006. b. Disease specific program duration. The graph illustrates numbers of patients (frequency) by treatment modality (allogeneic HSCT, blue; autologous HSCT, green) and a selected main indication (acute leukemia) according to the program duration in years for this indication of their respective transplant team. Note that program duration for allogeneic HSCT was longer than for autologous HSCT, as illustrated above in Fig. 1a; Numbers of allogeneic HSCT for acute leukemia were higher than numbers of autologous HSCT. For other main disease indications, see supplementary Fig. 1. c. Center patient volume. The graph depicts the number of patients (frequency) according to treatment modality (allogeneic HSCT, blue; autologous HSCT, green) and main indication (lymphoma) by the number of patients treated for this disease by their respective transplant team in their respective transplant year. Note that the number of patients transplanted with an allogeneic HSCT is much lower than the number of patients transplanted with an autologous HSCT for this indication; that fewer centers performed allogeneic HSCT for this indication and with lower patient numbers. For other main disease indications, see supplementary Fig. 1. (For interpretation of the references to color in this figure legend, the reader is referred to the web version of this article.)
Fig. 2
Fig. 2
Center specific microeconomic aspects and overall survival. The graphs illustrate Cox model estimates of overall survival of 37,542 patients with an allogeneic HSCT by center specific microeconomic aspects (for definitions see Methods section). The model integrates year of transplant, years of experience, size of the center, main disease indication, EBMT risk score, conditioning and accreditation status as factors. a. Patient volume. The graph shows Cox model estimates of overall survival depending on patient volume in absolute numbers. Numbers give numbers of patients treated for the respective disease in the year of the transplant at the patients' center (0–4 patients blue, 5–9 patients green, 10–14 patients yellow, 15–19 patients purple, 20 patients and > 20 patients red). b. Program duration. The graph shows Cox model estimates of overall survival depending on the centers program duration in years for. Numbers give numbers of years of program duration at the time of the transplant (0–4 years blue, 5–9 years green, 10–14 years yellow, 15–19 years purple, 20 years and > 20 years red). (For interpretation of the references to color in this figure legend, the reader is referred to the web version of this article.)
Fig. 3
Fig. 3
Country specific macroeconomic aspects and overall survival: impact of total Health Care Expenditures as a fraction of GNI/cap. The graphs depict the regression analyses of the country specific risk of death (inverse of overall survival) after HSCT against the respective countries Health Care Expenditures as a fraction of its GNI/cap. Country specific hazard ratios were adjusted for established treatment, disease, patient and donor risks factors as well as for center size, center experience and center accreditation (for details see Methods section). 3a. Allogeneic HSCT. The graph depicts the regression analysis of country specific hazards after allogeneic HSCT against the Health Care Expenditures as a fraction of GNI/cap. Spearman rank test: R2 = 0·21; p = 0·01. Abbreviations correspond to the respective country codes. b. Autologous HSCT. The graph depicts the regression analysis of country specific hazards after autologous HSCT against the Health Care Expenditures as a fraction of GNI/cap. Spearman R2 = 0·03 (3% explained variance); p = 0·38. Abbreviations correspond to the respective country codes.

Comment in

Similar articles

Cited by

References

    1. Waitzkin H. Report of the WHO Commission on Macroeconomics and Health: a summary and critique. Lancet. 2003;361:523–526. - PubMed
    1. White S.L., Hirth R., Mahíllo B. The global diffusion of organ transplantation: trends, drivers and policy implications. Bull. World Health Organ. 2014;92:826–835. - PMC - PubMed
    1. Gratwohl A., Pasquini M.C., Aljurf M. For the Worldwide Network of Blood and Marrow Transplantation WBMT. One million haemopoietic stem-cell transplants: a retrospective observational study. Lancet Haematol. 2015;2:e91–100. - PubMed
    1. Copelan E.A. Hematopoietic stem-cell transplantation. N. Engl. J. Med. 2006;354:1813–1826. - PubMed
    1. Majhail N.S., Mau L.W., Denzen E.M., Arneson T.J. Costs of autologous and allogeneic hematopoietic cell transplantation in the United States: a study using a large national private claims database. Bone Marrow Transplant. 2013;48:294–300. - PMC - PubMed

Publication types