

Costs of migratory decisions: A comparison across eight white stork populations
- PMID: 26844294
- PMCID: PMC4737271
- DOI: 10.1126/sciadv.1500931
Costs of migratory decisions: A comparison across eight white stork populations
Abstract
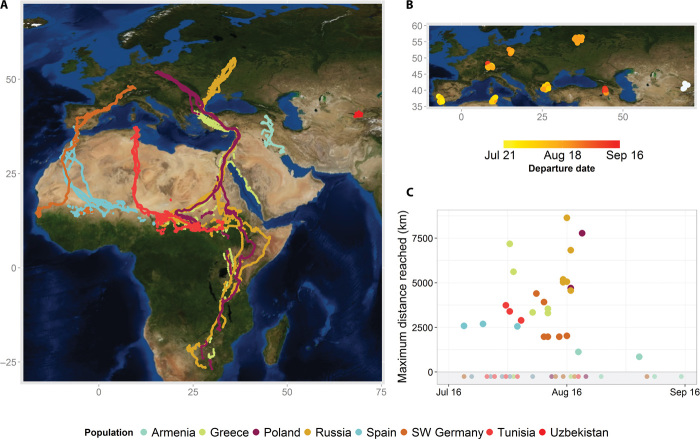
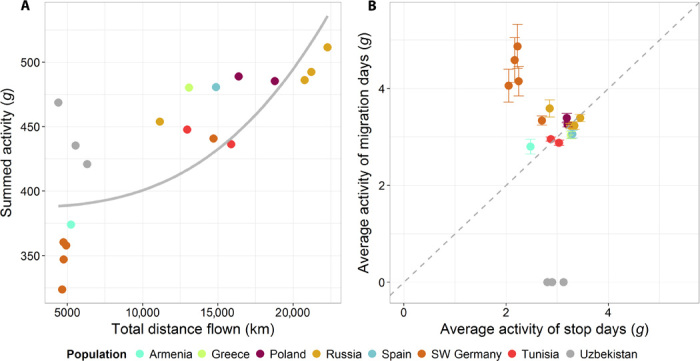
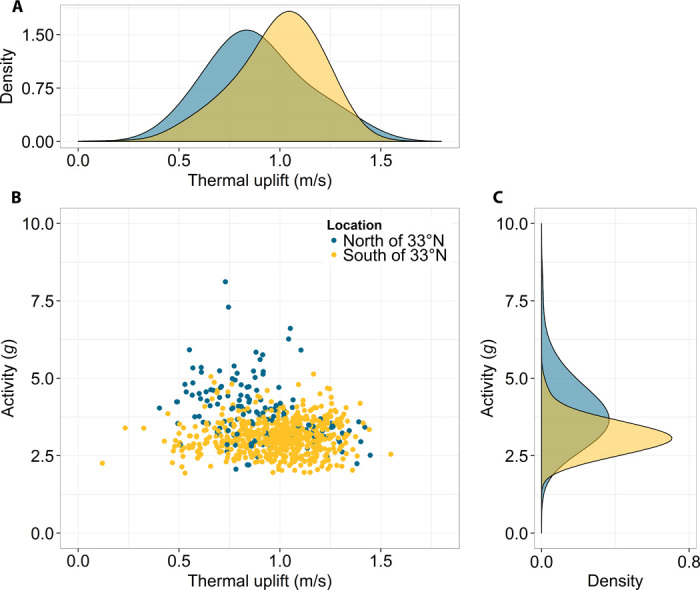
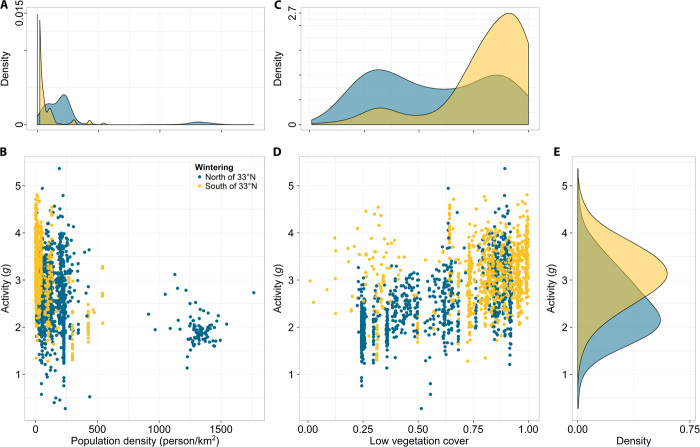
Annual migratory movements can range from a few tens to thousands of kilometers, creating unique energetic requirements for each specific species and journey. Even within the same species, migration costs can vary largely because of flexible, opportunistic life history strategies. We uncover the large extent of variation in the lifetime migratory decisions of young white storks originating from eight populations. Not only did juvenile storks differ in their geographically distinct wintering locations, their diverse migration patterns also affected the amount of energy individuals invested for locomotion during the first months of their life. Overwintering in areas with higher human population reduced the stork's overall energy expenditure because of shorter daily foraging trips, closer wintering grounds, or a complete suppression of migration. Because migrants can change ecological processes in several distinct communities simultaneously, understanding their life history decisions helps not only to protect migratory species but also to conserve stable ecosystems.
Keywords: Animal movement; White storks; acceleration; energy expenditure; high-resolution GPS; lifetime tracking; migration costs; population comparison.
Figures
References
-
- I. Newton, The Migration Ecology of Birds (Academic Press, London, 2008).
-
- Kays R., Crofoot M. C., Jetz W., Wikelski M., Terrestrial animal tracking as an eye on life and planet. Science 348, aaa2478 (2015). - PubMed
-
- Halsey L. G., Shepard E. L. C., Wilson R. P., Assessing the development and application of the accelerometry technique for estimating energy expenditure. Comp. Biochem. Physiol. A Mol. Integr. Physiol. 158, 305–314 (2011). - PubMed
-
- Williams T. M., Wolfe L., Davis T., Kendall T., Richter B., Wang Y., Bryce C., Elkaim G. H., Wilmers C. C., Instantaneous energetics of puma kills reveal advantage of felid sneak attacks. Science 346, 81–85 (2014). - PubMed
-
- Wilson R. P., White C. R., Quintana F., Halsey L. G., Liebsch N., Martin G. R., Butler P. J., Moving towards acceleration for estimates of activity-specific metabolic rate in free-living animals: The case of the cormorant. J. Anim. Ecol. 75, 1081–1090 (2006). - PubMed
Publication types
MeSH terms
LinkOut - more resources
Full Text Sources
Other Literature Sources
