. 2016 Jan 22;2(1):e1501177.
doi: 10.1126/sciadv.1501177. eCollection 2016 Jan.

Metainference: A Bayesian inference method for heterogeneous systems

Affiliations

Metainference: A Bayesian inference method for heterogeneous systems

Massimiliano Bonomi et al. Sci Adv. .

Abstract

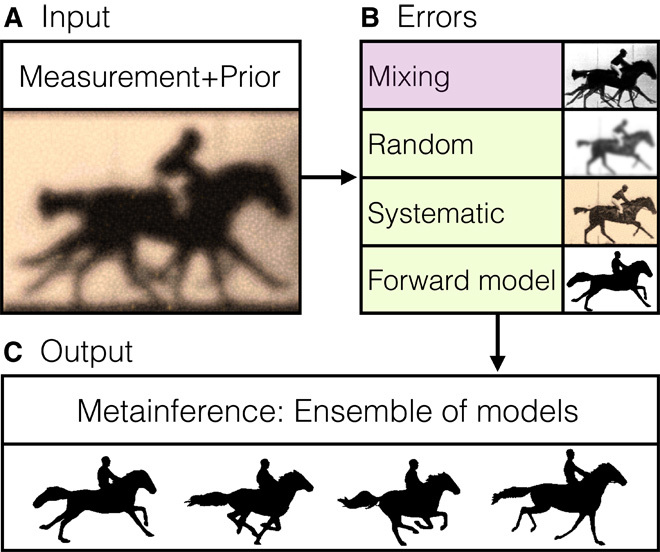
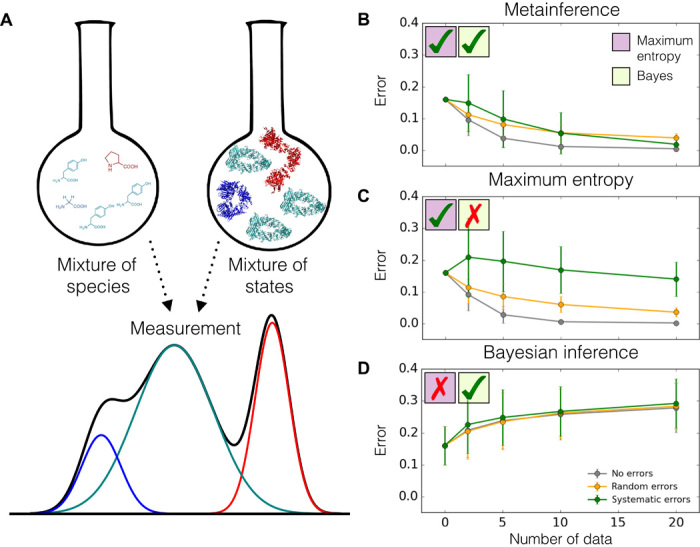
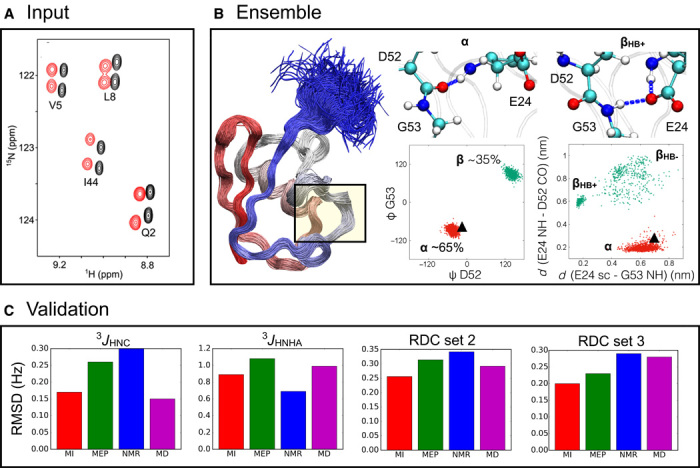
Modeling a complex system is almost invariably a challenging task. The incorporation of experimental observations can be used to improve the quality of a model and thus to obtain better predictions about the behavior of the corresponding system. This approach, however, is affected by a variety of different errors, especially when a system simultaneously populates an ensemble of different states and experimental data are measured as averages over such states. To address this problem, we present a Bayesian inference method, called "metainference," that is able to deal with errors in experimental measurements and with experimental measurements averaged over multiple states. To achieve this goal, metainference models a finite sample of the distribution of models using a replica approach, in the spirit of the replica-averaging modeling based on the maximum entropy principle. To illustrate the method, we present its application to a heterogeneous model system and to the determination of an ensemble of structures corresponding to the thermal fluctuations of a protein molecule. Metainference thus provides an approach to modeling complex systems with heterogeneous components and interconverting between different states by taking into account all possible sources of errors.

Keywords: Statistical inference; maximum entropy principle; structural biology.


Figures

Fig. 1
Fig. 1. Schematic illustration of the metainference method.
(A and B) To generate accurate and precise models from input information (A), one must recognize that data from experimental measurements are always affected by random and systematic errors and that the theoretical interpretation of an experiment may also be inaccurate (B; green). Moreover, data collected on heterogeneous systems depend on a multitude of states and their populations (B; purple). (C) Metainference can treat all of these sources of error and thus it can properly combine multiple experimental data with prior knowledge of a system to produce ensembles of models consistent with the input information.
Fig. 2
Fig. 2. Metainference of a model heterogeneous system.
(A) Equilibrium measurements on mixtures of different species or states do not reflect a single species or conformation but are instead averaged over the whole ensemble. (B to D) We describe such a scenario using a model heterogeneous system composed of multiple discrete states on which we tested metainference (B), the maximum entropy approach (C), and standard Bayesian modeling (D), using synthetic data. We assess the accuracy of these methods in determining the populations of the states as a function of the number of data points used and the level of noise in the data. Among these approaches, metainference is the only one that can deal with both heterogeneity and errors in the data; the maximum entropy approach can treat only the former, whereas standard Bayesian modeling can treat only the latter.
Fig. 3
Fig. 3. Scaling of the metainference harmonic restraint intensity in the absence of noise in the data.
We verified numerically that in the absence of noise in the data and with a Gaussian noise model, the intensity of the metainference harmonic restraint k=r=1N1σr2, which couples the average of the forward model over the N replicas to the experimental data point (Eq. 7), scales as N2. This test was carried out in the model system at five discrete states, with 20 data points and with the prior at 16% accuracy. For each of the 20 data points, we report the average restraint intensity over the entire Monte Carlo simulation and its SD when using 8, 16, 32, 64, 128, and 256 replicas. The average Pearson’s correlation coefficient on the 20 data points is 0.999991 ± 3 × 10⁻⁶, showing that metainference coincides with the replica-averaging maximum entropy modeling in the limit of the absence of noise in the data.
Fig. 4
Fig. 4. Analysis of the inferred uncertainties.
(A and B) Distributions of inferred uncertainties (PDF) in the presence of systematic errors, using (A) a Gaussian data likelihood with one uncertainty per data point and (B) the outliers model with one uncertainty per data set. This test was carried out in the model system at five discrete states, with 20 data points (of which eight were outliers), 128 replicas, and the prior at 16% accuracy. For the Gaussian noise model, we report the distributions of three representative points not affected by noise (σ13B) and of two representative points affected by systematic errors (σ4B and σ5B). For the outliers model, we report the distribution of the typical data set uncertainty (σ0B).
Fig. 5
Fig. 5. Example of the application of metainference in integrative structural biology.
(A) Comparison of the metainference and maximum entropy approaches by modeling the structural fluctuations of the protein ubiquitin in its native state using NMR chemical shifts and RDC data. (B) The metainference ensemble supports the finding (36) that a major source of dynamics involves a flip of the backbone of residues D52-G53 (B; left scatterplot), which interconverts between an α state with a 65% population and a β state with a 35% population. This flip is coupled with the formation of a hydrogen bond between the side chain of E24 and the backbone of G53 (B; right scatterplot); the state in which the hydrogen bond is present (βHB+) is populated 30% of the time, and the state in which the hydrogen bond is absent (βHB−) is populated 5% of the time. By contrast, the NMR structure (Protein Data Bank code 1D3Z) provides a static picture of ubiquitin in this region in which the α state is the only populated one (black triangle). (C) Validation of the metainference (MI; red) and maximum entropy principle (MEP; green) ensembles, along with the NMR structure (blue) and the MD ensemble (purple), by the backcalculation of experimental data not used in the modeling: 3JHNC and 3JHNHA scalar couplings and two independent sets of RDCs (RDC sets 2 and 3).
Fig. 6
Fig. 6. Distributions (PDF) of restraint intensities for different chemical shifts of ubiquitin.
When combining data from different experiments, metainference automatically determines the weight of each piece of information. In the case of ubiquitin, the NH and HN chemical shifts were determined as the less reliable data and thus were downweighted in the construction of the ensemble of models. From this procedure it is not possible to determine whether these two specific data sets have a higher level of random or systematic noise, or whether instead the CAMSHIFT predictor (38) is less accurate for these specific nuclei.

Similar articles

Cited by

References

    1. G. E. Box, G. C. Tiao, Bayesian Inference in Statistical Analysis (John Wiley & Sons, New York, 2011), vol. 40.
    1. Bernardo J. M., Smith A. F., Bayesian Theory (John Wiley & Sons, New York, 2009), vol. 405.
    1. P. M. Lee, Bayesian Statistics: An Introduction (John Wiley & Sons, New York, 2012).
    1. Jaynes E. T., Information theory and statistical mechanics. Phys. Rev. 106, 620–630 (1957).
    1. Tavaré S., Balding D. J., Griffiths R. C., Donnelly P., Inferring coalescence times from DNA sequence data. Genetics 145, 505–518 (1997). - PMC - PubMed