

A TCRβ Repertoire Signature Can Predict Experimental Cerebral Malaria
- PMID: 26844551
- PMCID: PMC4742225
- DOI: 10.1371/journal.pone.0147871
A TCRβ Repertoire Signature Can Predict Experimental Cerebral Malaria
Abstract
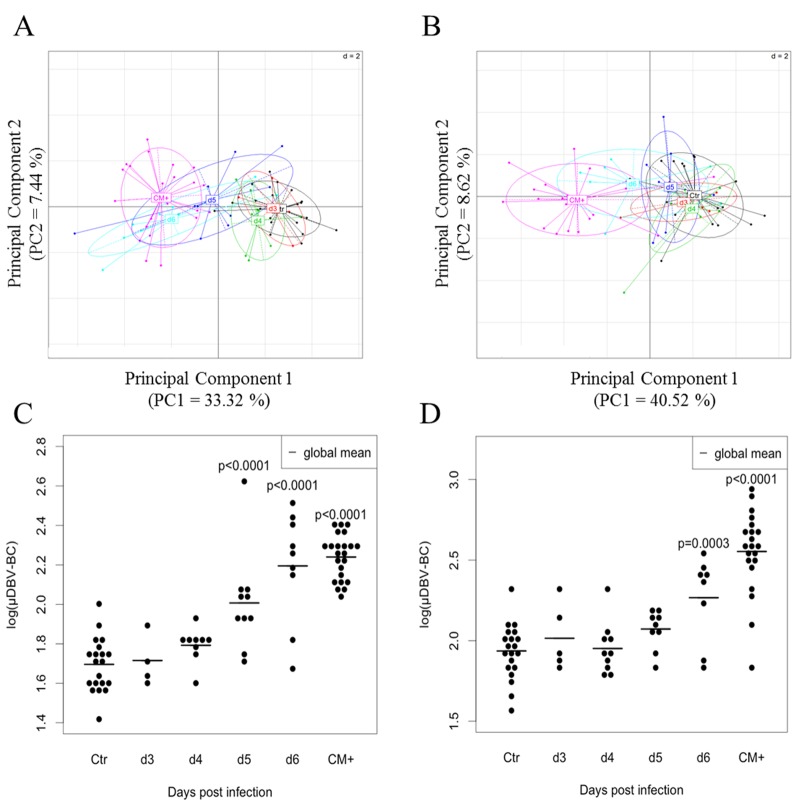
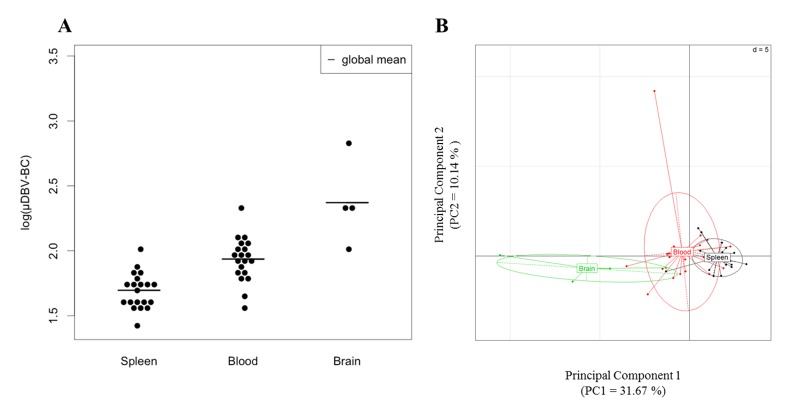
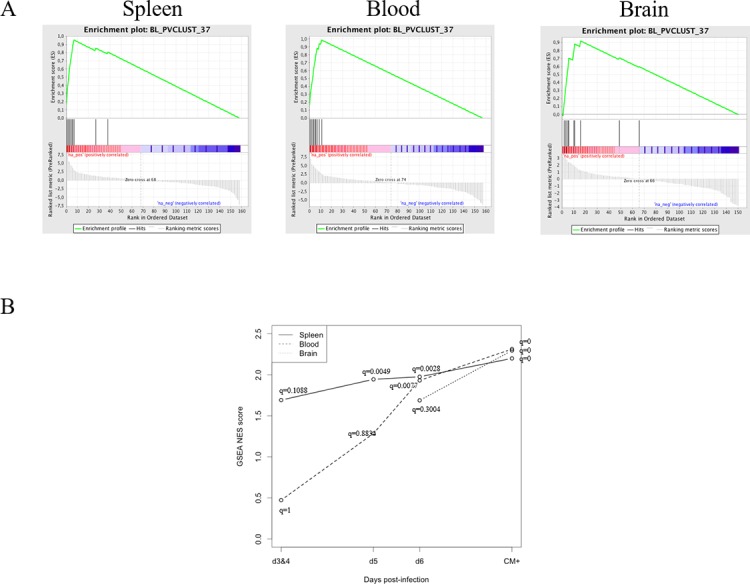
Cerebral Malaria (CM) is associated with a pathogenic T cell response. Mice infected by P. berghei ANKA clone 1.49 (PbA) developing CM (CM+) present an altered PBL TCR repertoire, partly due to recurrently expanded T cell clones, as compared to non-infected and CM- infected mice. To analyse the relationship between repertoire alteration and CM, we performed a kinetic analysis of the TRBV repertoire during the course of the infection until CM-related death in PbA-infected mice. The repertoires of PBL, splenocytes and brain lymphocytes were compared between infected and non-infected mice using a high-throughput CDR3 spectratyping method. We observed a modification of the whole TCR repertoire in the spleen and blood of infected mice, from the fifth and the sixth day post-infection, respectively, while only three TRBV were significantly perturbed in the brain of infected mice. Using multivariate analysis and statistical modelling, we identified a unique TCRβ signature discriminating CM+ from CTR mice, enriched during the course of the infection in the spleen and the blood and predicting CM onset. These results highlight a dynamic modification and compartmentalization of the TCR diversity during the course of PbA infection, and provide a novel method to identify disease-associated TCRβ signature as diagnostic and prognostic biomarkers.
Conflict of interest statement
Figures


Similar articles
-
A profound alteration of blood TCRB repertoire allows prediction of cerebral malaria.J Immunol. 2004 Oct 1;173(7):4568-75. doi: 10.4049/jimmunol.173.7.4568. J Immunol. 2004. PMID: 15383590
-
Suppression of CD4+ Effector Responses by Naturally Occurring CD4+ CD25+ Foxp3+ Regulatory T Cells Contributes to Experimental Cerebral Malaria.Infect Immun. 2015 Nov 9;84(1):329-38. doi: 10.1128/IAI.00717-15. Print 2016 Jan. Infect Immun. 2015. PMID: 26553468 Free PMC article.
-
Suppressor of cytokine signaling 2 modulates the immune response profile and development of experimental cerebral malaria.Brain Behav Immun. 2016 May;54:73-85. doi: 10.1016/j.bbi.2016.01.002. Epub 2016 Jan 4. Brain Behav Immun. 2016. PMID: 26765997
-
Genetic analysis of cerebral malaria in the mouse model infected with Plasmodium berghei.Mamm Genome. 2018 Aug;29(7-8):488-506. doi: 10.1007/s00335-018-9752-9. Epub 2018 Jun 19. Mamm Genome. 2018. PMID: 29922917 Review.
-
Changes in brain metabolites in experimental cerebral malaria infection with plasmodium berghei ANKA: a literature review.J Pak Med Assoc. 2014 Oct;64(10):1179-85. J Pak Med Assoc. 2014. PMID: 25823161 Review.
Cited by
-
RepSeq Data Representativeness and Robustness Assessment by Shannon Entropy.Front Immunol. 2018 May 15;9:1038. doi: 10.3389/fimmu.2018.01038. eCollection 2018. Front Immunol. 2018. PMID: 29868003 Free PMC article.
-
A noncanonical autophagy is involved in the transfer of Plasmodium-microvesicles to astrocytes.Autophagy. 2022 Jul;18(7):1583-1598. doi: 10.1080/15548627.2021.1993704. Epub 2021 Nov 6. Autophagy. 2022. PMID: 34747313 Free PMC article.
-
A Conserved TCRβ Signature Dominates a Highly Polyclonal T-Cell Expansion During the Acute Phase of a Murine Malaria Infection.Front Immunol. 2020 Nov 23;11:587756. doi: 10.3389/fimmu.2020.587756. eCollection 2020. Front Immunol. 2020. PMID: 33329568 Free PMC article.
-
A T Cell Receptor Locus Harbors a Malaria-Specific Immune Response Gene.Immunity. 2017 Nov 21;47(5):835-847.e4. doi: 10.1016/j.immuni.2017.10.013. Epub 2017 Nov 14. Immunity. 2017. PMID: 29150238 Free PMC article.
-
Perturbations in the T cell receptor β repertoire during malaria infection in children: A preliminary study.Front Immunol. 2022 Oct 13;13:971392. doi: 10.3389/fimmu.2022.971392. eCollection 2022. Front Immunol. 2022. PMID: 36311775 Free PMC article.
References
-
- World Health Organization. World malaria report 2013. [S.l.]; 2014.
-
- Berendt AR, Turner GDH, Newbold CI. Cerebral malaria: the sequestration hypothesis. Parasitol Today. 1994;10: 412–412. - PubMed
-
- Grau GE, Mackenzie CD, Carr RA, Redard M, Pizzolato G, Allasia C, et al. Platelet accumulation in brain microvessels in fatal pediatric cerebral malaria. J Infect Dis. 2003;187: 461–466. - PubMed
-
- Renia L, Potter SM, Mauduit M, Rosa DS, Kayibanda M, Deschemin J-C, et al. Pathogenic T cells in cerebral malaria. Int J Parasitol. 2006;36: 547–554. - PubMed
Publication types
MeSH terms
Substances
LinkOut - more resources
Full Text Sources
Other Literature Sources
