. 2016 Feb 3;89(3):521-35.
doi: 10.1016/j.neuron.2015.11.020.

Early Somatostatin Interneuron Connectivity Mediates the Maturation of Deep Layer Cortical Circuits

Affiliations

Early Somatostatin Interneuron Connectivity Mediates the Maturation of Deep Layer Cortical Circuits

Sebnem N Tuncdemir et al. Neuron. .

Abstract

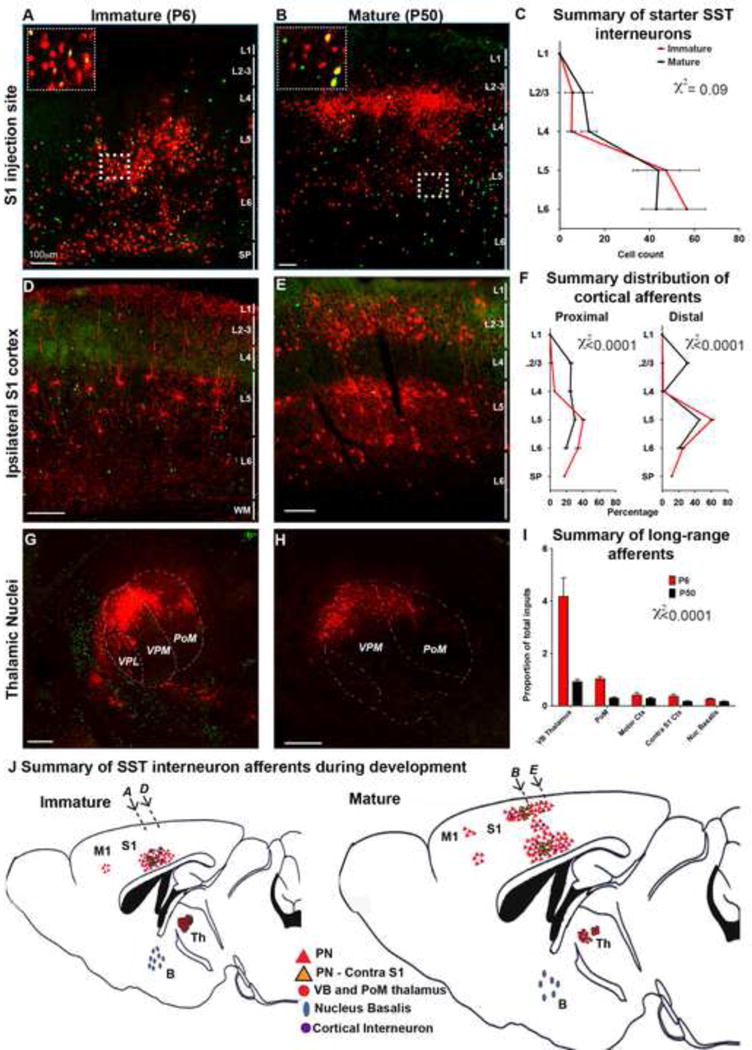
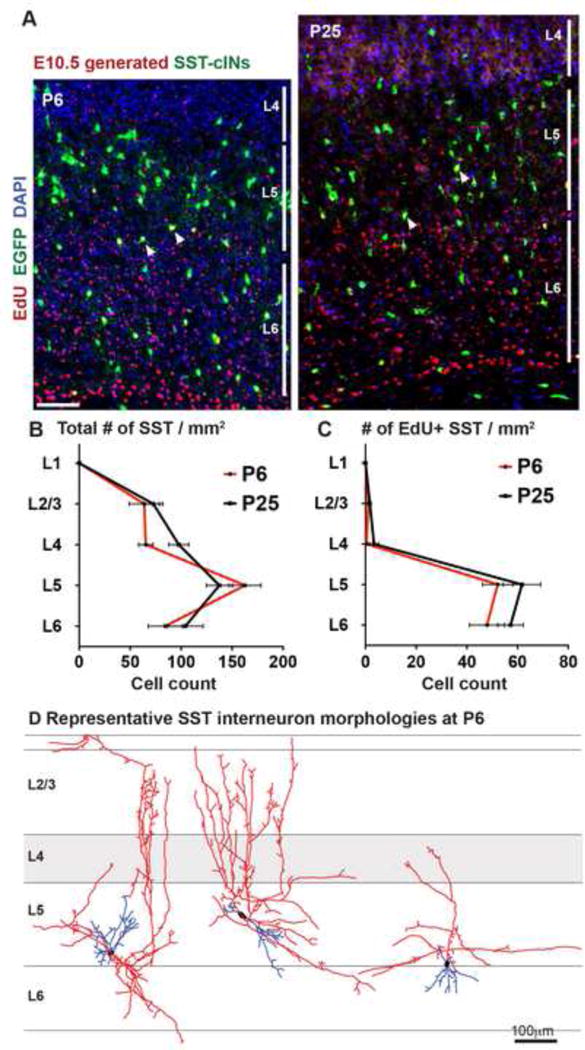
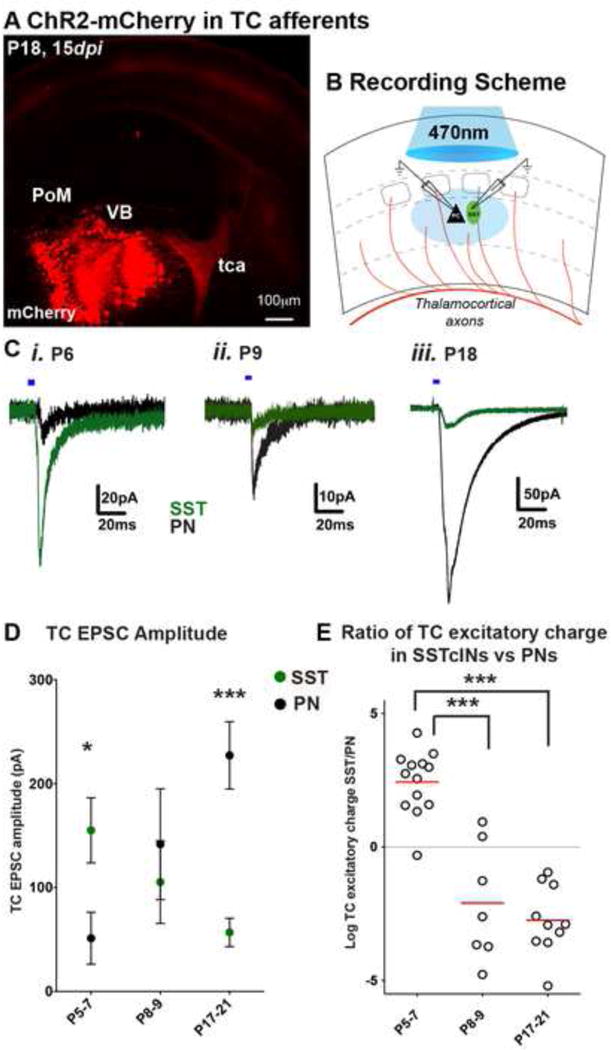
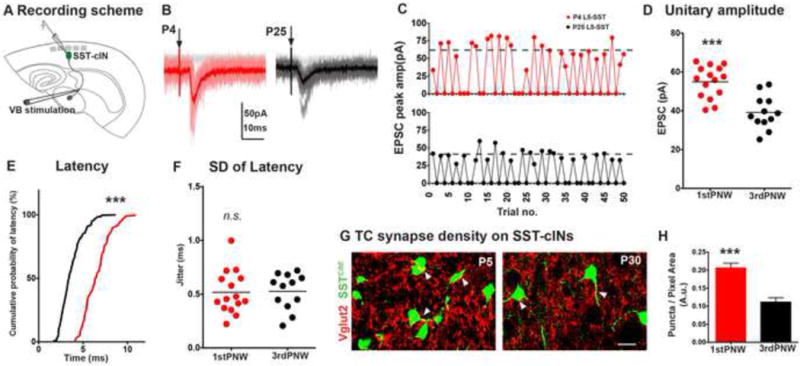
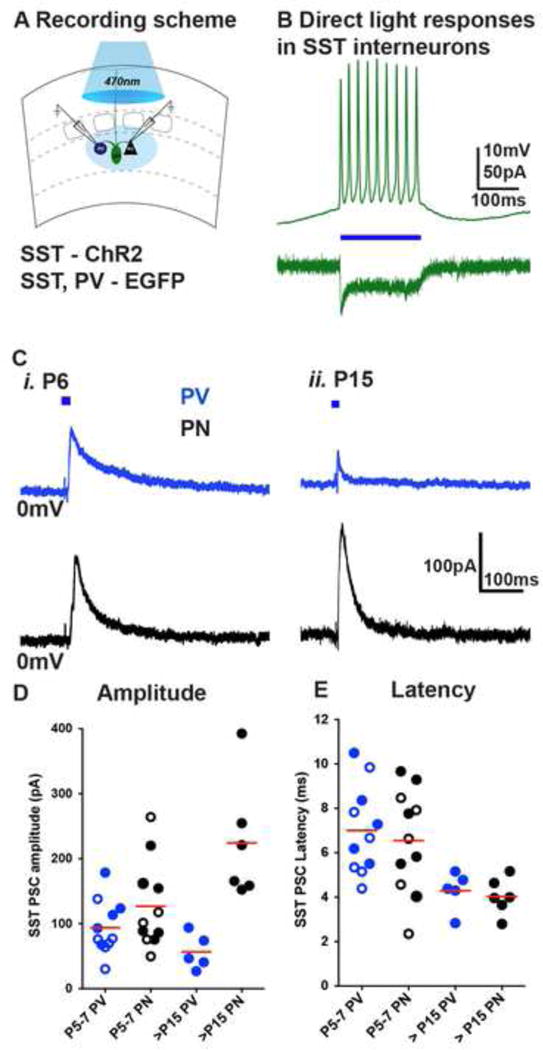
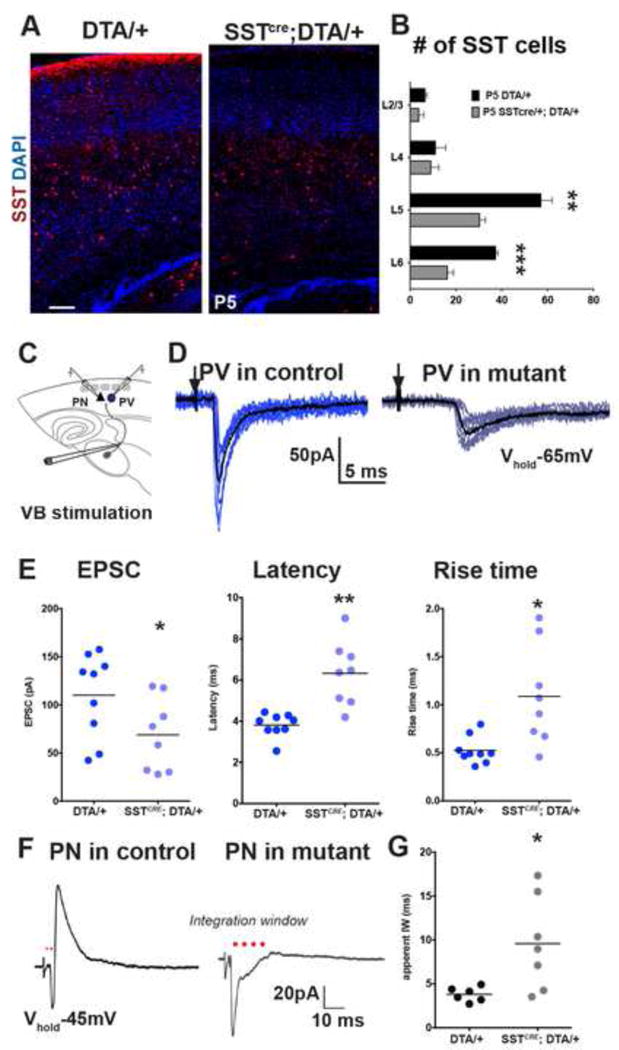
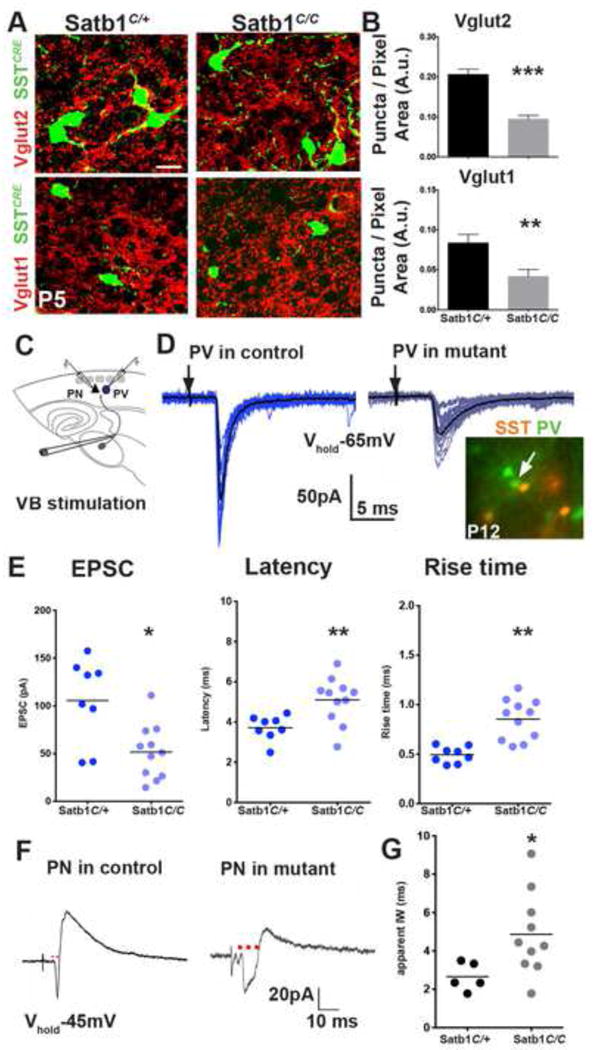
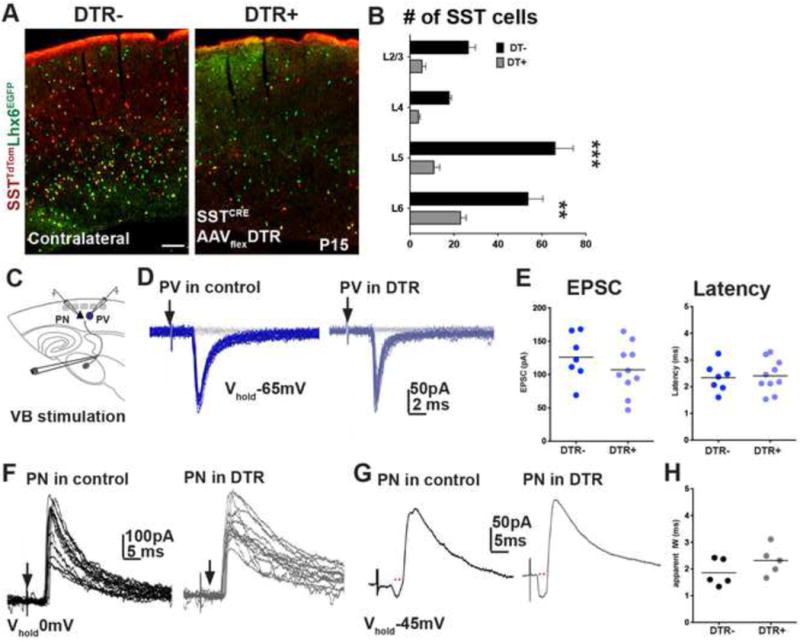
The precise connectivity of somatostatin and parvalbumin cortical interneurons is generated during development. An understanding of how these interneuron classes incorporate into cortical circuitry is incomplete but essential to elucidate the roles they play during maturation. Here, we report that somatostatin interneurons in infragranular layers receive dense but transient innervation from thalamocortical afferents during the first postnatal week. During this period, parvalbumin interneurons and pyramidal neurons within the same layers receive weaker thalamocortical inputs, yet are strongly innervated by somatostatin interneurons. Further, upon disruption of the early (but not late) somatostatin interneuron network, the synaptic maturation of thalamocortical inputs onto parvalbumin interneurons is perturbed. These results suggest that infragranular somatostatin interneurons exhibit a transient early synaptic connectivity that is essential for the establishment of thalamic feedforward inhibition mediated by parvalbumin interneurons.


Figures

Figure 1
Figure 1. SST interneurons undergo reorganization in their afferent connectivity during development
Representative images of the injection site in S1BC at P6 (A) and P50 (B) insets show higher magnification image of the SST neurons (green), starter neurons (yellow), and their presynaptic partners (red) in L5 (C) Starter neurons in immature (P6, n=5) and mature (P30, n=2, P50, n=5) animals predominantly localized in L5 and 6 with only a minority of the starter neurons in L2/3 and L4 that did not show statistically significant differences across two developmental stage (χ2=0.09). See also Table S1. (D) At P6 retrogradely labeled (mCh+) neurons found primarily in deep layers of ipsilateral cortex 300μm caudal to injection site. (E) Reorganization of presynaptic neurons at P50 in upper and deeper layers 300μm caudal to injection site. (F) The distribution of cortical inputs 150μm (left) and 300μm R-C (right) to the injection site. Data represents the averaged percentage of presynaptic neurons in a layer within the entire cortex ipsilateral to the injection site (χ2<0.001). (G) Subcortical afferent projections from ventrobasal (VB) and PoM nucleus of the thalamus at P6. (H) Thalamic inputs showed a reduction in older animals. (I) Proportion of presynaptic neurons projected from long-range regions, data represents the number of presynaptic neurons normalized to number of starter neurons in counted in 1/6th of brains. Long range afferents onto SST interneurons showed a statistically significant dependence on developmental stage (χ2<0.001). Mean ± SEM, Pearson’s chi-square test, scale bars 100μm, see also Figure S1. (J) Summary of SST interneuron afferents during development, arrows correspond to image locations in A, B, D and E.
Figure 2
Figure 2. Changes in SST interneuron afferent connectivity do not result from changes in the L5/6 population
(A) Genetically labeled SST interneurons born at E10.5 are saturation labelled with EdU and the number of SST interneurons were assessed at P6 (left) and and P25 (right). (B) The density of EGFP+ SST interneurons in per mm2 of each layer within infragranular layers of S1BC does not change when normalized to the brain volume at P6 and P25 (p>0.05) (C) The number of SST interneurons generated at E10.5 (EdU+EGFP+ doubled labeled cells) at P6 were not significantly different compared to P25 (p>0.05). n=3 animals, n ≥ 3 sections were analyzed per animal, mean ± SEM, two-sample t-test, scale bars 50μm, see also Figure S2. (D) Exemplary SST interneuron reconstructions at P6 obtained by diluted EnvA+RVdG-mCh injections into SSTCRE; Rosa-TVA mice displays heterogeneous morphological arborizations.
Figure 3
Figure 3. Functional monosynaptic thalamocortical inputs on SST interneurons are rapidly reduced after the first postnatal week
(A) AAV-ChR2-mCh injected on E14.5 or P1–3 to target thalamocortical afferents and examined 7–15 days later (See Figure S2). (B) Recording configuration for analyzing EPSCs from SST interneurons and adjacent PNs in the L5A/6B of barrel cortex. (C) Representative traces of light evoked thalamic EPSCs recorded at −65mV holding potential, in the presence of TTX (1μM) and 4-AP (800μM) from adjacently localized SST interneuron (green), and PN (black) EPSCs at P6, P9 and P18. Blue horizontal bars represent photostimulation (470nm, 5ms, 0.5 mW). Note that the amplitude of events are smaller in P8–9 intermediate time points due to shorter expression time of ChR2 (AAV injection on P1, recording 7–8 days post infection, dpi) compared to amplitude of events at P6 (11 dpi) or P18 (15 dpi) (D) Averaged TC EPSC amplitudes (pA) show P5–7 SST interneuron received stronger inputs compared to PNs (n=13, p<0.05); while the inputs were similar at P8–9 (n=7, p>0.05), SST interneuron inputs were significantly smaller than PN inputs at P17–21 (n=11, mean ± SEM, p<0.0001). (E) Log2 normalized ratio of excitatory charges (pC) recorded on SST interneurons and PNs show a dramatic reduction by the end of 1st postnatal week. SST interneuron vs PN charge ratio compared to both P8–9, and P17–21 (p<0.0001). For each time point, n ≥ 3 animals, n ≥ 2 brain slices were analyzed per animal, Mann-Whitney test, see also Figure S3 and Table S2.
Figure 4
Figure 4. Thalamic excitation of SST interneurons is reduced during development
(A) Synaptic events in SST interneurons recorded from L5B/L6A in a TC slice preparation at P3–6 and P20–25 using minimal stimulation protocol (50–500μA) to evoke EPSCs only in half of the trials. (B) Representative traces of TC-EPSCs in P4 (red) and P25 (black) SST interneurons. (C) Exemplary recording sessions showing distribution of minimal events during 50 sweeps, dashed lines represent the averaged potency. (D) Excluding failures, peak TC EPSCs in SST interneurons of immature brains (n=15) showed a small but significant improvement over mature SST interneurons than those of older mice (n=12, p<0.0001, Mann-Whitney test) (E). Thalamic EPSC latency was longer in immature mice, relative to older animals (p<0.0001, Kolmogorov-Smirnov test). (F) Mean standard deviation of latency was not significantly different between two ages (p>0.05, Mann-Whitney test). For each time point, n ≥ 4 animals, n ≥ 2 brain slices were analyzed per animal. See also Figure S4. (G) Vglut2 immunoflouroscence in genetically identified P5 (left), and P30 SST interneurons (right). Images are pseudocolored for clarity, scale bar corresponds to 10μm. (H) Vglut2 synaptic puncta density on SST interneurons were significantly larger in P5 animals compared to older animals (p<0.0001). n ≥ 9 areas analyzed from n ≥ 10 cells, 3 animals, 3 sections per animal, mean ± SEM, Mann-Whitney test.
Figure 5
Figure 5. Immature SST interneurons broadly innervate deep cortical layers
(A) ChR2 was targeted to SST interneurons by SSTCRE; Ai32ChR2-EYFP; Lhx6EGFP mouse line or AAV-flex-hChR2.mCherry virus injections into infragranular layers of SSTCRE; Lhx6EGFP mice and synaptic currents in Lhx6EGFP positive PV interneurons and adjacent PNs in the L5A/6B of barrel cortex recorded at 0mV holding potential, in the presence of NBQX (10μM) and DAP-5 (25μM). (B) Light (blue horizontal bar, 100ms) induced responses in SST interneurons. (C) Representative traces of SST interneuron evoked responses (5ms light pulses) in PV interneurons (blue) and PNs. (D) Representative fluorescent image of a P6 coronal slice containing ChR2-mCherry expressing SST interneurons 5 days after AAV-flex-hChR2.mCherry virus injections into infragranular layers of SSTCRE; Lhx6EGFP mice. (E) Light evoked synaptic currents at P6 in Lhx6EGFP positive PV interneurons and adjacent PNs in the L5A/6B of barrel cortex recorded at 0mV holding potential, in the presence of NBQX (10μM) and DAP-5 (25μM), blue horizontal bar indicates 10ms light pulse. (F) SST-PSC amplitudes in PV interneuron (transgenic closed circles, n=5; virus open circles, n=6) were similar in PNs (transgenic closed circles, n=6; virus open circles, n=5) at P5–6 (p>0.05), while PV interneuron (transgenic, n=5) were significantly smaller than PNs (transgenic, n=6) at P15–18 (p<0.0001). G) Latency of light-evoked IPSCs (ms) were similar among PV interneurons and PNs (p>0.05). For each time point, n=2 animals, n=2 brain slices were analyzed per animal, Mann-Whitney test
Figure 6
Figure 6. Ablation SST interneuron during early development leads to an arrest in PV interneuron input maturation
(A) SST immunoflouroscence in Rosa-DTAloxp/+ (left panel) and SSTCRE; Rosa-DTAloxp/+ (right panel). (B) SST interneuron numbers were significantly different in L5 and L6 in mutant animals compared to controls (p<0.001). N=3 mutant, n=4 control, n≥3 coronal sections were analyzed per animal, mean ± SEM, two-sample t-test. (C) Recording scheme. (D) Representative traces of unitary TC EPSCs in Lhx6EGFP positive PV interneurons in aged matched Rosa-DTAloxp/+ controls (dark blue, left) and SSTCRE; Rosa-DTAloxp/+ mutants (light blue, right) (stimulation intensity, 75 μA). (E) Evoked TC responses in PV interneurons in controls (n=9, 2 animals, 3 slices), and mutants (n=8, 2 animals, 4 slices) recorded between P10–12 showed significant differences in averaged peak amplitude (left, p<0.05), latency (middle, p<0.01), and rise time (right, p<0.05). (F) Representative traces of averaged EPSC-IPSC sequences in L5/6 PNs in control (left) and mutant animals (right) evoked by TC fiber stimulation at −45mV holding potential. (G) Population data representing the averaged integration window (IW, marked by red dots) in controls (n=6), and mutants (n=7, p<0.05). Mann-Whitney test, see also Figure S6.
Figure 7
Figure 7. Satb1 loss of function in SST interneurons leads to an arrest in PV interneuron input maturation
(A) Vglut2 (top), and Vglut1 (bottom) immunoflouroscence in genetically identified P5 Satb1C/+ control (left), and Satb1C/C mutant (right) SST interneurons. Scale bar corresponds to 10μm. (B) Vglut2 (top), and Vglut1 (bottom) synaptic puncta density on SST interneurons were significantly larger in controls compared to mutant animals (n≥10 areas analyzed from n≥12 cells, 3 animals, 3 sections per animal, mean ± SEM, p<0.0001, two-sample t-test). (C) Recording scheme. (D) Representative traces of EPSCs in PV interneurons in aged matched SSTCRE; Rosa-Ai9tdTomato; Satb1C/+ controls (P12, dark blue, left) and SSTCRE; Rosa-Ai9tdTomato; Satb1C/C mutants (P13, light blue, right) evoked by TC fiber stimulation at threshold (100 μA), bottom right image shows the Lhx6EGFP positive, Rosa-Ai9tdTomato negative cells targeted for recording. (E) Evoked TC responses in PV interneurons in controls (n=8, 2 animals, 3 slices), and mutants (n=11, 3 animals, 4 slices) recorded between P11–14 showed significant differences in averaged peak amplitude (left, p<0.05), latency (middle, p<0.01), and rise time (right, p<0.01). (F) Representative traces of averaged EPSC-IPSC sequences in L5/6 PNs in control (left) and mutant animals (right) evoked by TC fiber stimulation at −45mV holding potential. (G) Population data representing the averaged IW (red dots) in controls (n=5, 2 animals, 3 slices), and mutants (n=10, 3 animals, 5 slices, p<0.05). Mann-Whitney test, see also Figure S7.
Figure 8
Figure 8. Ablation SST interneuron network after second postnatal week do not affect TC inputs onto PV interneurons
(A) TdTomato and EGFP flourescence in AAV-flex-DTR.GFP injected (right) and contralateral (left) hemispheres of SSTCRE;Ai9TdTomato;Lhx6 EGFP animals. (B) Selective expression of DT in SSTCRE;Ai9TdTomato neurons after the first postnatal week leads to a significant reduction in the number in virus injected hemispheres compared contralateral side in all cortical layers (n=3, mean ± SEM, p<0.001, two-sample t-test). (C) Recording scheme. (D) Representative traces of unitary TC EPSCs in Lhx6EGFP positive PV interneurons in contralateral (dark blue, left) and AAV expressing mutants (light blue, right) hemispheres (stimulation intensity, 75 μA). (E) Evoked TC responses in PV interneurons in controls (n=10, 4 animals, 6 slices), and mutants (n=7, 4 animals, 4 slices) recorded between P13–17 did not show significant differences in averaged peak amplitude (left, p=0.26) or latency (right, p=0.78). (F) Overlay of IPSCs (Vhold = 0mV) recorded in PNs in control (left) and mutant (right) hemispheres. (G) Representative traces of IPSC sequences in L5/6 PNs in control (left) and mutant hemispheres (right) evoked by TC fiber stimulation at −45mV holding potential. (H) Averaged IW (red dots in G) in controls (n=5), and mutants (n=5, p=0.22). Mann-Whitney test.

Similar articles

Cited by

References

    1. Agmon A, Hollrigel G, O’Dowd DK. Functional GABAergic synaptic connection in neonatal mouse barrel cortex. J Neurosci. 1996;16:4684–4695. - PMC - PubMed
    1. Angevine JB, Jr, Sidman RL. Autoradiographic study of cell migration during histogenesis of cerebral cortex in the mouse. Nature. 1961;192:766–768. - PubMed
    1. Azim E, Jiang J, Alstermark B, Jessell TM. Skilled reaching relies on a V2a propriospinal internal copy circuit. Nature. 2014;508:357–363. - PMC - PubMed
    1. Bartolini G, Ciceri G, Marin O. Integration of GABAergic interneurons into cortical cell assemblies: lessons from embryos and adults. Neuron. 2013;79:849–864. - PubMed
    1. Batista-Brito R, Fishell G. The developmental integration of cortical interneurons into a functional network. Curr Top Dev Biol. 2009;87:81–118. - PMC - PubMed

Publication types