. 2016 Feb 3;89(3):536-49.
doi: 10.1016/j.neuron.2016.01.015.

A Transient Translaminar GABAergic Interneuron Circuit Connects Thalamocortical Recipient Layers in Neonatal Somatosensory Cortex

Affiliations

A Transient Translaminar GABAergic Interneuron Circuit Connects Thalamocortical Recipient Layers in Neonatal Somatosensory Cortex

Andre Marques-Smith et al. Neuron. .

Abstract

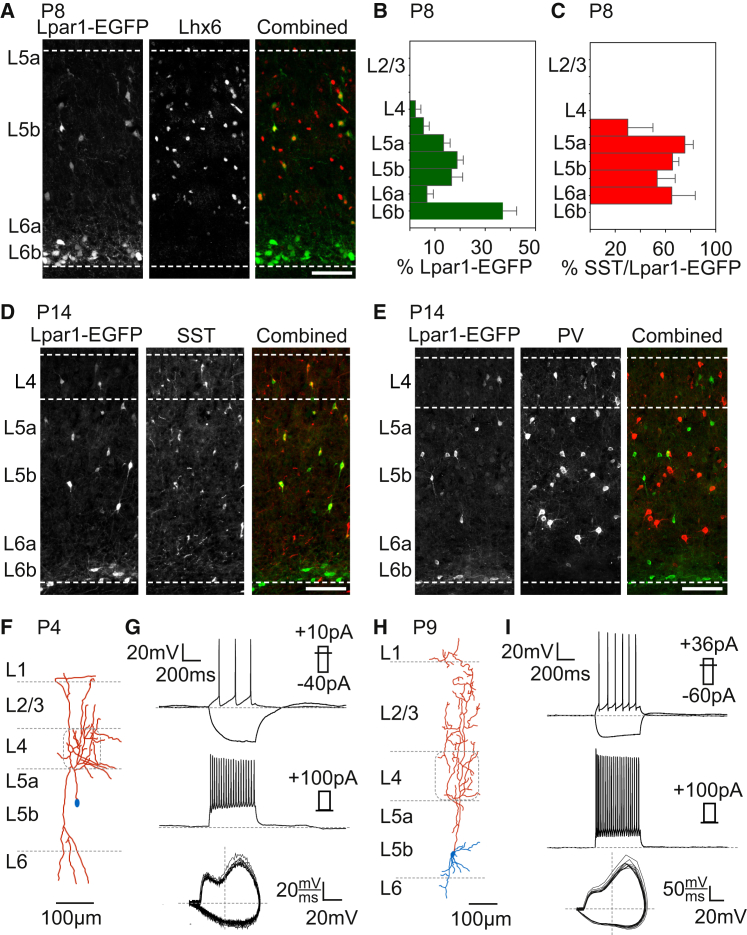
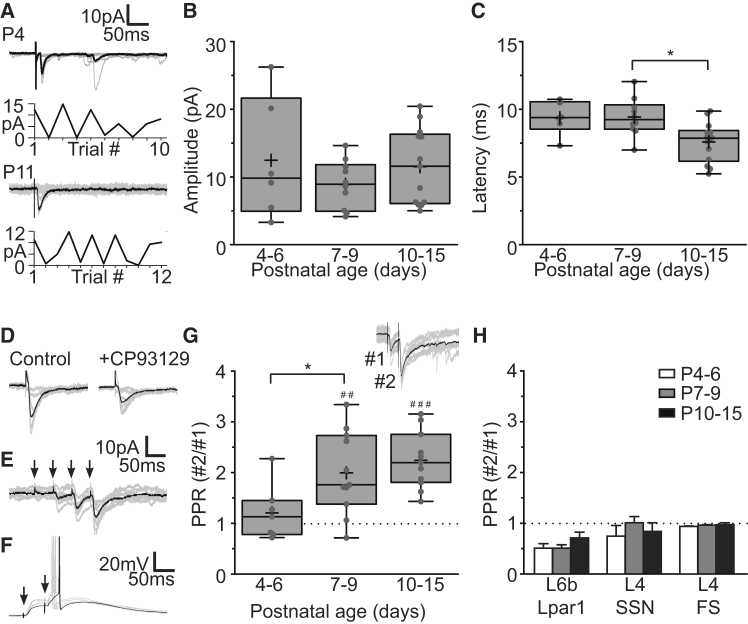
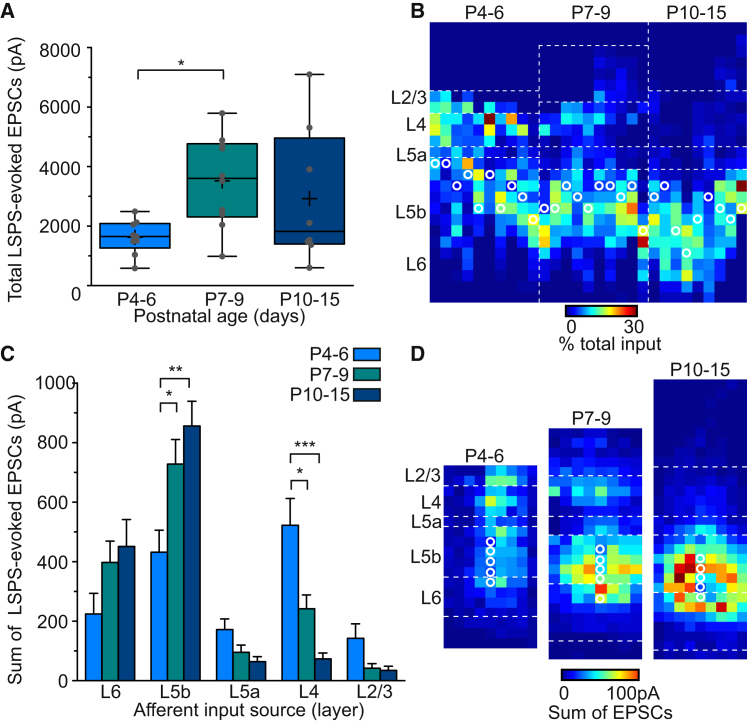
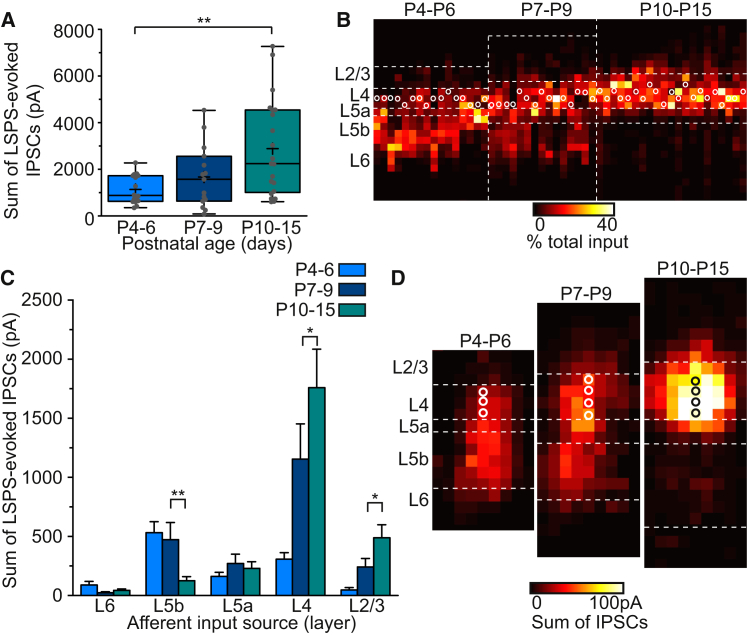
GABAergic activity is thought to influence developing neocortical sensory circuits. Yet the late postnatal maturation of local layer (L)4 circuits suggests alternate sources of GABAergic control in nascent thalamocortical networks. We show that a population of L5b, somatostatin (SST)-positive interneuron receives early thalamic synaptic input and, using laser-scanning photostimulation, identify an early transient circuit between these cells and L4 spiny stellates (SSNs) that disappears by the end of the L4 critical period. Sensory perturbation disrupts the transition to a local GABAergic circuit, suggesting a link between translaminar and local control of SSNs. Conditional silencing of SST+ interneurons or conversely biasing the circuit toward local inhibition by overexpression of neuregulin-1 type 1 results in an absence of early L5b GABAergic input in mutants and delayed thalamic innervation of SSNs. These data identify a role for L5b SST+ interneurons in the control of SSNs in the early postnatal neocortex.


Figures

Figure 1
Figure 1
Lpar1-EGFP Labels a Population of Infragranular SST+, Non-Fast Spiking Martinotti Cells (A) The Lpar1-EGFP transgene labeled cells (left panel) in P8 S1BF layer (L)5b that expressed Lhx6 (middle) in contrast to the other population of GFP+ cells in L6b (subplate) that are Lhx6-negative (right). y axis, location of the cortical layer (layer 5a to 6b); top dashed white line, L4-L5a border; scale bar, 100 μm. (B) The distribution of Lpar1-EGFP cells across the depth of a cortical column in P8 S1BF (n = 8 animals); y axis, average location of the cortical layer (L2/3 to 6b); error bars, ± SEM. (C) The percentage of Lpar1-EGFP cells that expressed SST across the depth of the cortex at P8; data presented as in (B). (D and E) At P15, L5b Lpar1-EGFP cells expressed SST (D) (n = 4 animals), whereas (E) none expressed the other principal marker of Lhx6+ INs, parvalbumin (PV); scale bar, 100 μm. (F) Reconstruction of an early (P4) biocytin-filled L5b Lpar1-IN. Even at early ages, the axon (red) of L5b Lpar1-INs extended to L1, characteristic of Martinotti cells. (G) Intrinsic electrophysiological profile of the Lpar1-IN shown in (F); top traces, current clamp response to threshold and hyperpolarising current step injections which identified the cell as a low-threshold spiking IN. Middle trace, response to depolarizing current injection to near-maximal firing frequency revealed spike frequency adaptation characteristic of non-fast spiking (NFS) INs. Bottom trace, AP phase (dV/dt) plot with a biphasic component during the rising phase of the AP typical of NFS subtypes regardless of developmental age. (H and I) Corresponding data for a P9 Lpar1-IN exhibiting extensive axonal arborisation (red) in layers 4 and 2/3 (H). The intrinsic electrophysiological profile of the P9 Lpar1-IN was consistent with a low-threshold, adapting NFS subtype (I).
Figure 2
Figure 2
Maturation of Thalamic Input onto Lpar1-INs over Early Postnatal Development (A) Voltage-clamp (VC; hp, −70 mV) recordings of synaptic responses (EPSC) observed in Lpar1-INs in response to electrical stimulation of the VPM at P4 (top panels; n = 10 sweeps, 60 s intervals) and P11 (bottom panels; n = 12 at 30 s intervals); corresponding plots, minimal electrical stimulation defined as when EPSCs were evoked on 50%–70% of trials. (B) EPSC amplitude (pA) recorded in Lpar1-INs during minimal stimulation of the VPM P4–P6 (n = 8), P7–P9 (n = 8), and P10–P15 (n = 14). Boxplot, small gray circles depict average EPSC amplitude for each cell; horizontal line, median; cross, mean; box, standard deviation; error bars, the spread of the data. (C) Latency to onset of the EPSC recorded in Lpar1-INs during minimal stimulation of the VPM. A difference was observed in the latency recorded in the P7–P9 and P10–P15 groups (p = 0.009; Kruskal-Wallis (K-W) test, H(2,28) = 9.463; Dunn) (D) Control TC-EPSCs (left) and those observed following 10 min perfusion with CP93129 (right). (E) Response of Lpar1-INs to repeat electrical stimulation (20 Hz; minimal stimulation) of the VPM at P8 (hp, −70 mV). (F) Suprathreshold response observed in an Lpar1-IN following paired-pulse stimulation (20 Hz) of the VPM at P11 under current clamp. (G) Paired-pulse ratio (PPR) of TC-EPSCs in Lpar1-INs through early postnatal development; inset, example paired-pulse response (hp, −70 mV). For each cell (small gray circles) 10–20 stimulation sweeps were averaged; #, significant short-term plasticity (##p = 0.002 T[10] = 4.1; ###p < 0.001 T(10) = 7.4; one-sample t test); , significant difference between groups (ANOVA p = 0.011, F(2,26) = 5.366). (H) TC-EPSC PPR of Lpar1-EGFP L6b subplate neurons, L4 SSNs, and L4 Fast-Spiking (FS) INs at P4–P6 (light gray), P7–P9 (dark gray), and P10–P15 (black histogram bars); n ≥ 6 for each bar.
Figure 3
Figure 3
LSPS of Caged Glutamate Reveals a Developmental Rearrangement in the Laminar Organization of Excitatory Synaptic Inputs onto L5b Lpar1-INs (A) Total LSPS-evoked excitatory synaptic input onto Lpar1-INs over early postnatal development; (p = 0.046; ANOVA, F[2,24] = 2.771). Boxplots shown as in Figure 2. (B) Excitatory inputs onto Lpar1-INs plotted across the depth of the cortex for all recorded cells (n = 29 cells). Each vertical array depicts the percent distribution of excitatory input onto a single recorded cell, the position of which is indicated by a white circle; dashed white lines, average layer boundaries. Cells are ordered by age, left to right, from P4 to P15. (C) Laminar distribution of excitatory synaptic input onto Lpar1-INs over development. After P4–P6, L5b input increases (ANOVA: P7–P9, p = 0.034, F[2,26] = 2.55; P10–P15, ∗∗p = 0.004, F(2,26) = 3.59, BfC), whereas L4 input decreases (ANOVA: P7–P9, p = 0.039, F(2,26) = 2.67; P10–P15, p < 0.001, F(2,24) = 4.49, BfC). (D) Average maps of excitatory synaptic input onto Lpar1-INs. Within each age group, maps of individual cells were aligned by the L4/5a border and input in each pixel averaged.
Figure 4
Figure 4
LSPS of Caged Glutamate Reveals a Developmental Rearrangement in the Spatial Organization of GABAergic Inputs onto S1BF L4 SSNs in the Early Postnatal Brain (A) Total columnar GABAergic synaptic input onto L4 SSNs through development. Values correspond to the total sum amplitude of LSPS-evoked GABAergic inputs onto SSNs; boxplots as in Figure 2 (K-W test, ∗∗p = 0.016, H[2,49] = 8.25; Dunn). (B) Remodeling of GABAergic inputs onto SSNs through development; plotted as for Figure 3B. (C) Laminar organization of GABAergic input onto SSNs. Between P4–P6 and P10–P15, L5b input decreases (K-W test ∗∗p = 0.004, H[3,52] = 18.7; Dunn), while L4 and L2/3 input increases (L4, K-W test, p = 0.011, H[2,49] = 23.0, Dunn; L2/3, Kruskal-Wallis test p < 0.028, H[3,52] = 24.5, Dunn). (D) Average maps of GABAergic synaptic input onto SSNs through early development; alignment as in Figure 3D.
Figure 5
Figure 5
Sensory Perturbation as a Result of ION Transection Delays the Transition to a Local L4 GABAergic Circuit (A) Average map (left) of evoked GABAergic input onto L4 SSNs in ION transected (IONcut) animals at P4–P6. Right, normalized laminar profile of GABAergic input onto SSNs recorded from control (blue) and IONcut (red) animals. (B) Corresponding data for SSNs in IONcut animals at P10–P15 (left). The normalized laminar profile (right) revealed an increase in L5b and a decrease in L4 GABAergic synaptic input (arrows) in IONcut animals (red) as compared to control (blue). (C) GABAergic input onto SSNs at P4–P6 is significantly reduced (∗∗∗p < 0.001, U = 10, M-W U test) compared to control, but recovers by P10–P15 (not significant [ns], p = 0.685 U = 115, M-W test). (D and E) Normalized laminar GABAergic input onto SSNs showed no difference between IONcut and control at P4–P6 (D), but an increase in input from L5b in IONcut (n = 12) compared to controls (n = 21) at P10–P15 (E) (L5b, ∗∗p = 0.006 K-W test, H[1,45] = 124.9; Dunn); error bars, ± SEM. (F) Total intralaminar (L4) GABAergic input onto SSNs between P4–P6 (black bars) and P10–P15 (gray) showed an increase in both control and IONcut (control, ∗∗∗p < 0.001 U = 19; IONcut, ∗∗∗p < 0.001 U = 0, M-W test); error bars, ± SEM. (G) Plot of total translaminar (L5b) GABAergic input onto SSNs between P4–P6 and P10–P15 showed a decrease in control but an increase in IONcut (control, ∗∗∗p < 0.001, U = 30; IONcut, ∗∗∗p < 0.001, U = 3, M-W test); error bars, ± SEM.
Figure 6
Figure 6
Conditional Knockout of Snap25 in SST+ INs Removes Early L5b GABAergic Input and Alters the Timeline for the Acquisition of L4 TC-EPSCs (A) Average LSPS map of GABAergic input onto early (P4–P6) L4 SSNs in wild-type (WT; n = 5 cells; 4 animals) and conditional knockout (cKO; SST-ires-Cre; Snap25C/C mice; n = 6 cells; 4 animals). (B) Laminar distribution of GABAergic input onto SSNs reveals a decrease in input from L5b (∗∗∗p < 0.001, ANOVA F[12,95] = 9.259) but an in increase in local L4 input (∗∗∗p < 0.001, ANOVA F[12,95] = 7.742); error bars, ± SEM. (C) Normalized distribution of GABAergic input onto SSNs (L5b, ∗∗p = 0.002; K-W, H[10,55] = 49.01; Dunn test); error bars, ± SEM. (D) Left, TC-EPSCs in SSNs from WT and cKO animals in which TC connectivity to cortex had been confirmed in SPNs. Right, TC-EPSC amplitude in WT (blue box) and cKO (green) pups; gray circles, average TC-EPSC amplitude for each cell; ∗∗p = 0.002, M-W test. (E–H) Corresponding data for SSNs recorded from P7–P9 WT (n = 6 cells) and cKO (n = 6) animals.
Figure 7
Figure 7
Failure of Early L5b GABAergic Synaptic Signaling and Delayed TC Input onto SSNs in an Nrg1type1-Overexpressing Mouse Line, Nrg1type1-tg (A) Total GABAergic input onto L4 SSNs in Nrg1type1-tg tg and nontransgenic WT littermates through early development. (B and C) The relative distribution of GABAergic inputs onto SSNs across the depth of the cortex in WT and tg animals; plots formatted as for Figure 3B. (D) Top: average maps of GABAergic synaptic input onto SSNs in WT and tg animals at P4–P6. (E) Plot of the total laminar GABAergic input onto SSNs in WT and tg animals at P4–P6. (L5b, ∗∗∗p < 0.001 U = 21; L4: ∗∗p = 0.010 U = 21, M-W test). (F and G) Data for SSNs recorded at P7–P9 (L5b, ∗∗p = 0.022 U = 0, M-W test). (H and I) Corresponding data for SSNs recorded at P10–P15. (J) Voltage-clamp (hp, −70 mV) responses recorded in SSNs in response to thalamic stimulation at P4–P9 (top) and P10–P15 (bottom) in cells recorded from WT (blue) and tg (orange) animals. Individual sweeps (n = 10) shown in gray, average response in color; arrows, time of stimulus. (K) Minimal stimulation TC-EPSC amplitude recorded in SSNs at P4–P9 (WT, n = 6; tg, n = 12 cells) and P10–P15 (WT, n = 5; tg, n = 8); blue bars, WT; orange, tg data (P4–P9, ∗∗∗p < 0.001 U = 0; P10–P15, ∗∗p = 0.0062 U = 2, M-W test) (L) Amplitude of TC-EPSCs recorded in L5b Lpar1-INs shown as in (K).
Figure 8
Figure 8
Transient Circuits Involving L5b SST+ GABAergic INs in the Early Postnatal S1BF (A) Diagrams of the circuits revealed in the current study at early ages (left panel), toward the end of the CPP (middle) and post-CPP (right). Black circle, GABAergic IN; filled circle ending, GABAergic synapse; white circle, glutamatergic neuron; flat line ending, glutamatergic synapse; gray dotted line connector, connection undergoing remodelling. L4, layer 4; L5b, layer 5b; SSN, spiny stellate neuron; SST+, Lpar1-EGFP, SST-expressing IN; Th, VPM nucleus. PV+, parvalbumin-expressing IN; , connections previously reported in the literature. (B) Alterations to the post-CPP circuit observed following ION transection. (C) Connections onto SSNs during the CPP following SST+ IN silencing by conditional knockout (cKO) of Snap25. Sparse dashed gray connector, a synaptic connection that is delayed relative to that observed in WT animals (see A). (D) The early transient circuit in Nrg1type1-tg animals.

Similar articles

Cited by

References

    1. Agmon A., Connors B.W. Thalamocortical responses of mouse somatosensory (barrel) cortex in vitro. Neuroscience. 1991;41:365–379. - PubMed
    1. Agmon A., Hollrigel G., O’Dowd D.K. Functional GABAergic synaptic connection in neonatal mouse barrel cortex. J. Neurosci. 1996;16:4684–4695. - PMC - PubMed
    1. Allendoerfer K.L., Shatz C.J. The subplate, a transient neocortical structure: its role in the development of connections between thalamus and cortex. Annu. Rev. Neurosci. 1994;17:185–218. - PubMed
    1. An S., Yang J.W., Sun H., Kilb W., Luhmann H.J. Long-term potentiation in the neonatal rat barrel cortex in vivo. J. Neurosci. 2012;32:9511–9516. - PMC - PubMed
    1. An S., Kilb W., Luhmann H.J. Sensory-evoked and spontaneous gamma and spindle bursts in neonatal rat motor cortex. J. Neurosci. 2014;34:10870–10883. - PMC - PubMed

Publication types

LinkOut - more resources