. 2016 Feb 3;89(3):629-44.
doi: 10.1016/j.neuron.2015.12.035.

Sensorimotor Transformations Underlying Variability in Song Intensity during Drosophila Courtship

Affiliations

Sensorimotor Transformations Underlying Variability in Song Intensity during Drosophila Courtship

Philip Coen et al. Neuron. .

Abstract

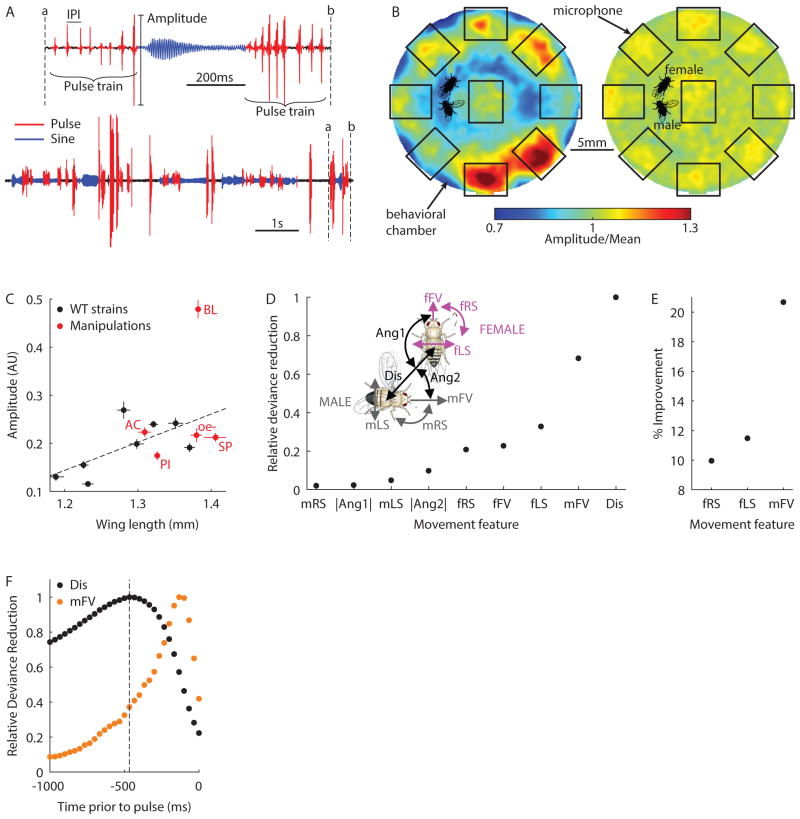
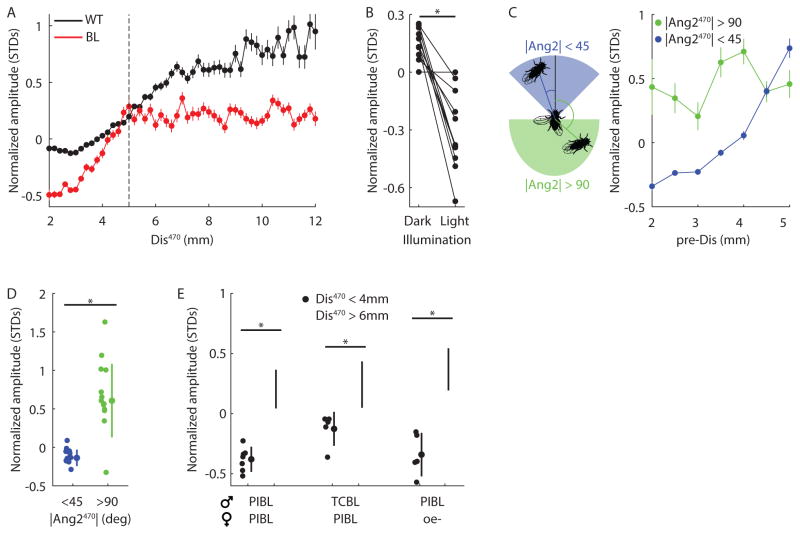
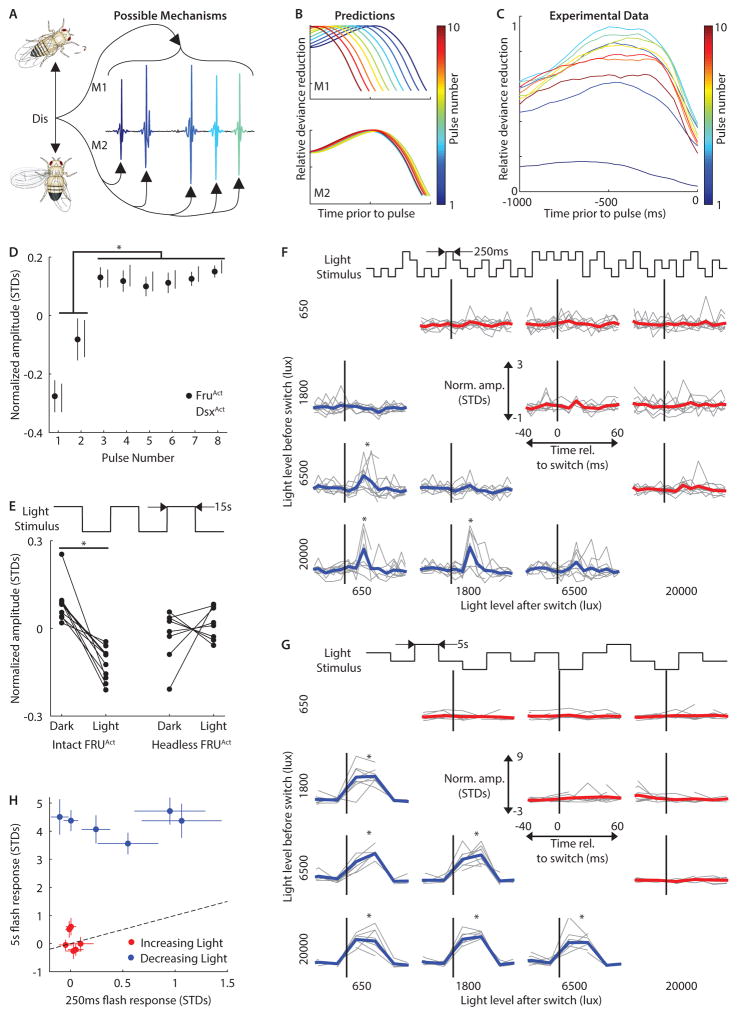
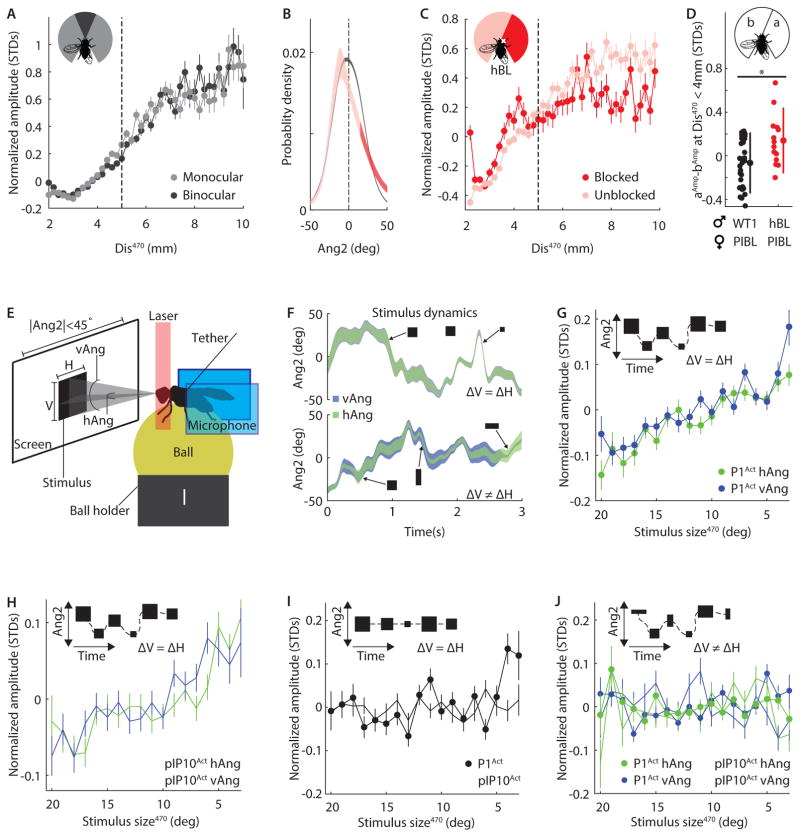
Diverse animal species, from insects to humans, utilize acoustic signals for communication. Studies of the neural basis for song or speech production have focused almost exclusively on the generation of spectral and temporal patterns, but animals can also adjust acoustic signal intensity when communicating. For example, humans naturally regulate the loudness of speech in accord with a visual estimate of receiver distance. The underlying mechanisms for this ability remain uncharacterized in any system. Here, we show that Drosophila males modulate courtship song amplitude with female distance, and we investigate each stage of the sensorimotor transformation underlying this behavior, from the detection of particular visual stimulus features and the timescales of sensory processing to the modulation of neural and muscle activity that generates song. Our results demonstrate an unanticipated level of control in insect acoustic communication and uncover novel computations and mechanisms underlying the regulation of acoustic signal intensity.


Figures

Figure 1
Figure 1. Song amplitude modulation with distance in Drosophila
A, Drosophila song is composed of pulse (red) and sine (blue) elements. Males produce trains of pulses which vary in amplitude and are separated by species-typical inter-pulse intervals (IPI). B, Pulse amplitudes for each male position within the chamber (as a fraction of the overall mean amplitude) before (left) and after (right) normalization (n = 795,152 pulses from 380 flies, see Experimental Procedures). Microphone positions and fly images are included for scale. C, Mean pulse amplitude (arbitrary units) versus wing length across 8 wild type strains (black, n = 28–39 flies). Five manipulations are also shown (red, n = 11–30 flies): deaf (AC for arista cut), blind (BL), or pheromone insensitive (PI) males paired with pheromone insensitive and blind (PIBL) females, and WT1 males paired with unreceptive females (SP for sex peptide injected) or females genetically engineered to lack pheromone producing cells (oe-). Linear fit (dashed line) is for wild type data only (r2 = 0.46). All flies included in this plot sang > 200 pulses. Error bars indicate SEM. D, Relative deviance reduction for generalized linear models (GLMs) designed to predict amplitude from a single feature (see Experimental Procedures). Inset, Illustration of 9 features used as predictors in the GLM: male/female forward velocity (mFV/fFV), male/female lateral and rotational speeds (mLS/fLS and mRS/fRS), the distance between fly centers (Dis), the absolute angle from female/male heading to male/female center (Ang1/Ang2). E, The percentage improvement in the model after combining Dis with a second feature. F, Relative deviance reduction for GLMs designed to predict amplitude from Dis (black) or mFV (orange) at specified delays prior to each pulse. Dashed line highlights maximally predictive time point for Dis (−470ms). D–F, n = 361,817 pulses from 226 flies, 95% confidence intervals are too small to visualize. Each fly sang > 500 pulses. (See also Figures S1 and S2)
Figure 2
Figure 2. The role of vision in AMD
A, Normalized amplitude (measured in standard deviations (STDS) from the mean) versus distance at 470ms prior to the pulse (Dis470). Bin width 0.2mm for all WT (black, n = 226 flies) and BL (red, n = 25 flies) males. Dashed line indicates 5mm boundary, beyond which BL flies did not exhibit amplitude modulation with distance (AMD). For Dis470 below and above 5mm, r2 = 0.85/0.94, and r2 = 0.80/0.01 for WT/BL flies. > 100 pulses contributed to each point. B, WT1 males (paired with PIBL females) produced louder pulses in the dark. *P < 10−4, n = 12 flies singing > 200 pulses in each condition. Lights were switched on or off every 15s during courtship. C, Left, Illustration of regions within the male visual field that constitute |Ang2| < 45° (blue) or |Ang2| > 90° (green). Right, For pulses produced by BL flies at Dis470 < 5mm (bin width 0.5mm), amplitude was dependent or independent of Dis470 if the male faced toward (|Ang2|470 < 45°, blue, r2 = 0.94) or away from (|Ang2|470 > 90°, green, r2 = 0.12) the female. > 25 pulses contributed to each point. n = 25 flies. D, Blind flies sang louder pulses at Dis470 < 4mm (chosen to avoid 5mm boundary) when facing the female (blue) versus when facing away from her (green). *P < 10−5, n = 13 flies singing > 10 pulses in each condition. E, PIBL or TCBL (tarsi cut and blind) males reduced amplitude when close to the female (Dis470 < 4mm, closed circles), even when paired with oe-females (PIBL males only). *P < 0.05, n = 5–7 flies singing > 100 pulses in each condition. A–D Each fly sang > 500 pulses. A and C, error bars indicate SEM. D–E, individual flies, mean, and STD are shown. (See also Figures S1, S2 and S3)
Figure 3
Figure 3. Timescales of AMD
A, Possible mechanisms for amplitude modulation with distance (AMD). Either distance information modulates entire pulse trains (top, M1) or each individual pulse (bottom, M2). B, Predictions for relative deviance reduction from GLMs (compare with Fig. 1F) for the two mechanisms in A if data were separated by pulse number and GLMs were designed to predict amplitude from the Dis feature at the specified delays prior to each pulse. C, Relative deviance reduction curves from the data support M2. n = 15,648–52,478 pulses from 226 flies for each GLM. D, Normalized amplitude for each pulse number produced by FRUAct (activated fruitless-expressing neurons, closed circles) and DSXAct (activated doublesex-expressing neurons, open circles) males without a female. *P < 0.05, n = 4–9 flies singing > 100 pulses for each point. Genotypes were combined for ANOVA. E, When switching between light conditions every 15s (see Experimental Procedures), FRUAct flies sang louder pulses in the dark (n = 10, *P < 0.001) but not if headless (n = 8, P > 0.4). Each fly sang > 200 pulses during each condition (light or dark). F, Light-transition-triggered average for normalized amplitude produced by FRUAct flies relative to increases (red) or decreases (blue) in light intensity. Intensity switches (between 4 light levels) occurred every 250ms (bin width 10ms, black line = 0ms). Data from Individual flies are in gray. *P < 0.05, n = 5–9 flies in each time bin. G, As in F, but for switches every 5s (bin width 25ms). * P < 0.01, n = 3–10 flies in each time bin. H, Pulse amplitude response (defined in Experimental Procedures) for 250ms versus 5s stimuli (see Experimental Procedures). Pulse amplitudes following decreasing light switches (blue) but not increasing light switches (red) were larger for 5s stimuli (blue, P < 0.01; red, P > 0.08). n = 5–10 flies. E and H, Error bars indicate SEM. C–G Each fly sang > 500 pulses. (See also Figures S4 and S5)
Figure 4
Figure 4. Computations underlying distance estimation
A, Normalized amplitude versus Dis470 (bin width 0.2mm) for all WT males. Data was split into times when the female occupied the binocular (dark gray, |Ang2|470 < 15°, r2 = 0.94) or monocular (light gray, |Ang2|470 > 15°, r2 = 0.92) region of the male’s visual field. n = 226 flies. B, Probability density of pulse production versus female angular location (Ang2) for WT (black, n = 226 flies) and half-blind (hBL, red, n = 15 flies) males. Light/dark red represent the unblocked/blocked regions of visual field. Line width indicates 95% confidence interval. C, Normalized amplitude versus Dis470 (bin width 0.2mm) for hBL males. Data was split into times when the female occupied the unblocked (light red, −160° < Ang2470 < 15°) or blocked (dark red, 15° < Ang2470 < 160°) region of visual field. Dashed line indicates 5mm boundary, beyond which AMD was exclusively vision dependent. For Dis470 below and above 5mm, r2 = 0.97/0.54, and r2 = 0.69/0.06 for the unblocked/blocked region of space. n = 15 flies. D, Difference in normalized amplitude for pulses produced when female was in visual field a versus b for WT1 (black, n = 29 flies) and hBL (red, n = 14 flies). Flies sang > 50 pulses in each region. * P < 0.01. Individual flies, mean, and STD are shown. E, Diagram of tethered fly-on-a-ball setup. Two microphones (blue rectangles) recorded song while an infrared laser heated the fly to activate subsets of song neurons (P1 or pIP10). Visual stimuli were presented at 144Hz. The horizontal (H) and vertical (V) stimulus dimensions, and the azimuthal motion (ΔAng2), varied according to the natural statistics of female motion on the male retina during courtship (see Experimental Procedures). Stimulus size was defined by the subtended angle of the stimulus at the fly’s eye, divided into horizontal (hAng) and vertical (vAng) components. Ang2 represents the angular position of the stimulus on the male retina. F, Example of visual stimulus dynamics. Ang2 versus time for two different stimuli: Top, ΔV = ΔH. Ang2 ranges from −45° to +45° and hAng (green) is marginally smaller than vAng (blue, barely visible). Bottom, ΔV ≠ ΔH. hAng (green) and vAng (blue) vary independently. Line width indicates the size of the stimulus and arrows show example stimuli. G, Normalized amplitude versus stimulus size for P1Act males (n = 8) presented with naturalistic stimuli (ΔH = ΔV and −45° < Ang2470 < 45°). Activated males show AMD in response to this stimulus (r2 = 0.88/0.77 for hAng470/vAng470). H, As In G, but for pIP10Act males (n = 8). r2 = 0.83/0.68 for hAng470/vAng470. H, As in G, but without changes in azimuthal position (Ang2 = 0 and ΔH = ΔV). Neither P1Act (n = 6, r2 = 0.25) nor pIP10Act (n = 6, r2 = ≤ 0.02) males showed AMD for this stimulus. I, As in G, but stimuli presented to P1Act (n = 6) and pIP10Act (n = 5) flies changed size independently for horizontal and vertical dimensions (ΔH ≠ ΔV and −45° < Ang2470 < 45°). Males did not show AMD in response to this stimulus (r2 = ≤ 0.21). A, C–D, and F–J, > 100 pulses contributed to each point. Error bars indicate SEM. A–D and F–J, All flies sang > 500 pulses. (See also Figure S6)
Figure 5
Figure 5. Motion- and loom-sensitive visual circuits are not required for AMD
A, Simplified diagram of the elementary motion detection (EMD) pathway. Three critical neural classes, silenced in pairs for this study, are labeled: lamina output neurons (L1 and L2), lamina feedback neurons (C2 and C3), and lobula plate columnar cells (T4 and T5). B, Ability of male to follow the female during courtship was quantified as the percentage of song pulses produced at distances > 5mm from the female. We observed following defects upon silencing EMD neural subsets with expression of inward-rectifying K+ channel (Kir) (L1L2Kir, C2C3Kir, and T4T5Kir) compared with control flies (ContKir; see Table S1 for genotypes). *P < 0.01, n = 11–22. C, However, AMD was unaltered: normalized amplitude versus Dis470 (bin width 0.5mm) for each strain from B, r2 ≥ 0.81, n = 11–21 flies. D, As in B, but for neural subsets silenced with tetanus toxin (TNT) (L1L2TNT and C2C3TNT) compared to control flies (ContTNT). *P < 10−4, n = 9–34. E, As in B but for neural subsets silenced by expressing temperature-sensitive shibire at a non-permissive temperature (T4T5Shi, ~28°C, n = 17) compared to control flies recorded at the permissive temperature (Cont1Shi, ~22°C, n = 17) *P < 0.05. F, As in C, but using the strains from D–E, r2 ≥ 0.86. n = 8–34 flies. G, Schematic of the only identified loom-sensitive neurons (Foma-1). H, As in E, but for flies expressing shibireTS in loom-sensitive neurons at non-permissive (Foma1shi) or permissive (Cont2Shi) temperatures. I, As in C, but using the strains from H, r2 ≥ 0.89. n = 9–10 flies. B, DE, and H, Individual flies, mean, and STD are shown. All flies sang > 250 pulses. Dashed line indicates mean fraction of pulses produced beyond 5mm for blind flies. C, F, and I, > 100 pulses contributed to each point and all flies sang > 500 pulses. Error bars indicate SEM. (See also Figure S7)
Figure 6
Figure 6. Descending visuomotor pathway
A, Diagram of alternative pathways for visual information (about distance to the female) interacting with the song motor pathway (at the level of the song pathway itself (M1) or directly with motor neurons or muscles (M2)). B, Diagram of the four previously identified components of the song circuit(von Philipsborn et al., 2011). Number of neurons in each hemisphere is indicated in parentheses. P1 neurons innervate the brain only, pIP10 is a descending neuron, while dPR1 and vPR6 neurons innervate the ventral nerve cord. vPR6 is thought to be integral to the pulse song central pattern generator (CPG). C, Shapes of “activated” pulses produced by males expressing TrpA1 (thermosensitive cation channel) in the song neurons described in B. Shaded area indicates 95% confidence interval. D, Males with artificially activated song neurons produced more pulses when not facing the female than WT1 flies. *P < 10−14, n = 8–39 flies. E, Normalized amplitude versus Dis470 (bin width 0.5mm) for P1Act males (n = 11) paired with PIBL females. AMD was observed when the males faced toward (closed circles, r2 = 0.95) but not away from (open circles, r2 = 0.20) females. F, P1Act males reduced pulse amplitude when facing the female. n = 11, *P < 10−4. G, As in E, but for pIP10Act males (n = 12). AMD was observed when the males faced toward (closed circles, r2 = 0.76) but not away from (open circles, r2 = 0.18) the female. H, pIP10Act males reduced pulse amplitude when facing the female. n = 12, *P < 10−5. I, As in E, but for dPR1Act males (n = 10). In contrast with PIAct and pIP10Act, pulse amplitude decreased with increasing Dis470 (opposite of AMD) when males faced toward (closed circles, r2 = 0.52) but not away from (open circles, r2 = 0.08) the female. J, dPR1Act males increased pulse amplitude when facing the female. n = 10, *P < 10−4. K, As in E, but for vPR6Act males (n = 8). Pulse amplitude is independent of Dis470 whether males faced toward (closed circles, r2 = 0.16) or away from (open circles, r2 = 0.06) the female. L, vPR6Act males did not change pulse amplitude when facing the female. n = 10, *P > 0.81. M, Dual mutant males (orange) produced pulses of lower amplitude relative to matched controls (black). Error bars indicate SEM. Dashed line represents linear fit to wild type data (from Figure 1C). Inset, diagram of the indirect flight muscles (IFMs, orange). N, Normalized pulse amplitude versus Dis470 (bin width 0.5mm). AMD was observed for control (black, r2 = 0.93) males, whereas Dual mutant males displayed a weak anti-correlation between Dis470 and amplitude (r2 = 0.44). O, Simultaneous song and extracellular IFM recordings in P1Act males. For each song pulse, a corresponding spike rate was calculated over the preceding 5s and normalized for individual flies. Increased spike rates predict larger pulse amplitudes (closed circles, r2 = 0.81) but are not correlated with the inter-pulse interval (open circles, r2 = 0.02). n = 6 flies for each point. Error bars indicate SEM. Inset, raw song (bottom) and extracellular IFM recordings (top, triangles indicate identified spikes). D, F, H, J, and L, Individual flies, mean, and STD are shown. E, G, I, K, and N, > 100 pulses contributed to each point and all flies sang > 500 pulses. Error bars indicate SEM. C–O, All flies sang > 500 pulses. (See also Figures S1 and S8)
Figure 7
Figure 7. Proposed mechanism of AMD
Correlated changes in height and width, as well as lateral motion, of the female (black square) are processed through a monocular circuit in the male brain. Two-dimensional expansion information is extracted by a distance estimation pathway, which does not depend on either the identified elementary motion detection (EMD) or loom detection pathway. Distance information then intersects with the song motor pathway in the ventral nerve cord (VNC), downstream of song command neurons (P1 and pIP10). The song central pattern generator modulates the firing rate of motor neurons (MNs) that target the indirect flight muscles to adjust pulse amplitude. The latency between visual stimuli reaching the eye (a) and modulating pulse amplitude (b) is < 30ms, and visual stimulus history of < 2s, but > 250ms influences circuit output.

Similar articles

Cited by

References

    1. Alexander R. Aggressiveness, Territoriality, and Sexual Behavior in Field Crickets (Orthoptera: Gryllidae) Behaviour. 1961;17:130–223.
    1. Ali F, Otchy T, Pehlevan C, Fantana A, Burak Y, Ölveczky B. The Basal Ganglia Is Necessary for Learning Spectral, but Not Temporal, Features of Birdsong. Neuron. 2013;80 - PMC - PubMed
    1. Aptekar Kele, Lu Zolotova, Frye Neurons Forming Optic Glomeruli Compute Figure-Ground Discriminations in Drosophila. Journal of Neuroscience. 2015;35:75877599. - PMC - PubMed
    1. Bath D, Stowers J, Hörmann D, Poehlmann A, Dickson B, Straw A. FlyMAD: rapid thermogenetic control of neuronal activity in freely walking Drosophila. Nature Methods. 2014;11 - PubMed
    1. Behnia R, Clark D, Carter A, Clandinin T, Desplan C. Processing properties of ON and OFF pathways for Drosophila motion detection. Nature. 2014;512:427–430. - PMC - PubMed

Publication types

LinkOut - more resources