

Behavioral Pure-Tone Threshold Shifts Caused by Tympanic Membrane Electrodes
- PMID: 26845670
- PMCID: PMC4925235
- DOI: 10.1097/AUD.0000000000000275
Behavioral Pure-Tone Threshold Shifts Caused by Tympanic Membrane Electrodes
Abstract
Objective: To determine whether tympanic membrane (TM) electrodes induce behavioral pure-tone threshold shifts.
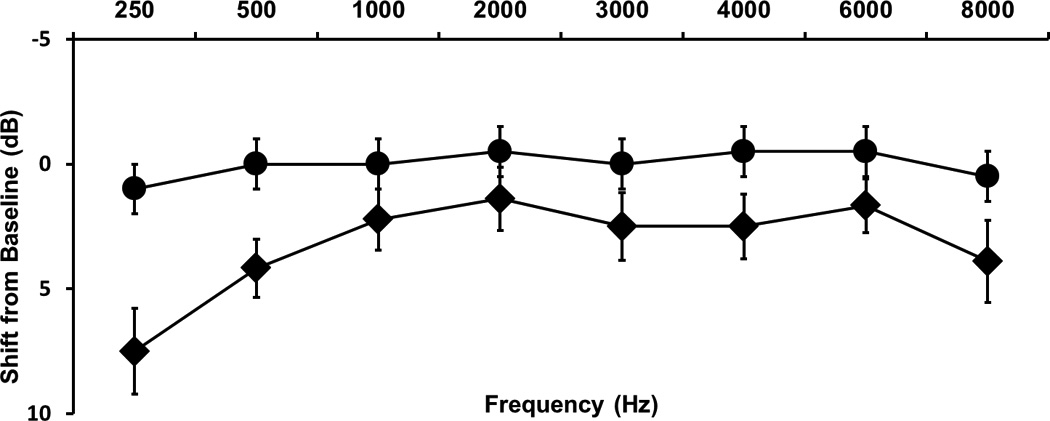
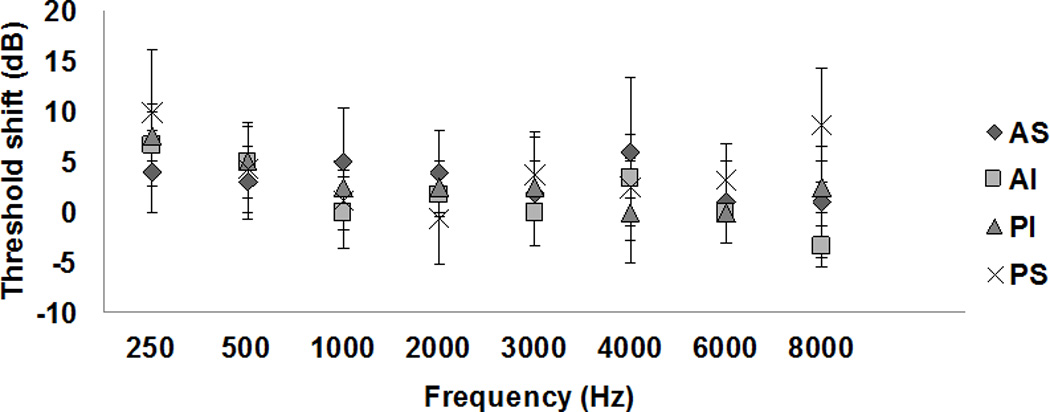
Design: Pure-tone thresholds (250 to 8000 Hz) were measured twice in test (n = 18) and control (n = 10) groups. TM electrodes were placed between first and second threshold measurements in the test group, whereas the control group did not receive electrodes. Pure-tone threshold shifts were compared between groups. The effect of TM electrode contact location on threshold shifts was evaluated in the test group.
Results: TM electrodes significantly increased average low-frequency thresholds, 7.5 dB at 250 Hz and 4.2 dB at 500 Hz, and shifts were as large as 25 dB in individual ears. Also, threshold shifts did not appear to vary at any frequency with TM electrode contact location.
Conclusions: Low-frequency threshold shifts occur when using TM electrodes and insert earphones. These findings are relevant to interpreting electrocochleographic responses to low-frequency stimuli.
Figures

Similar articles
-
Pure-Tone Audiometry With Forward Pressure Level Calibration Leads to Clinically-Relevant Improvements in Test-Retest Reliability.Ear Hear. 2018 Sep/Oct;39(5):946-957. doi: 10.1097/AUD.0000000000000555. Ear Hear. 2018. PMID: 29470259
-
Maturation of the occlusion effect: a bone conduction auditory steady state response study in infants and adults with normal hearing.Ear Hear. 2011 Nov-Dec;32(6):708-19. doi: 10.1097/AUD.0b013e31821de1b0. Ear Hear. 2011. PMID: 21617531 Clinical Trial.
-
Comparison of pure tone audiometry and auditory steady-state responses in subjects with normal hearing and hearing loss.Eur Arch Otorhinolaryngol. 2010 Jan;267(1):43-9. doi: 10.1007/s00405-009-1014-8. Eur Arch Otorhinolaryngol. 2010. PMID: 19536554
-
Effect of loading of the central part of the tympanic membrane on pure tone audiometry.Acta Otorhinolaryngol Ital. 2018 Jun;38(3):229-235. doi: 10.14639/0392-100X-1457. Acta Otorhinolaryngol Ital. 2018. PMID: 29984800 Free PMC article. Clinical Trial.
-
Temporal resolution with click and pure tone stimuli in youngsters with normal hearing sensitivity.J Soc Bras Fonoaudiol. 2012;24(2):168-73. doi: 10.1590/s2179-64912012000200014. J Soc Bras Fonoaudiol. 2012. PMID: 22832686 English, Portuguese.
Cited by
-
Human Summating Potential Using Continuous Loop Averaging Deconvolution: Response Amplitudes Vary with Tone Burst Repetition Rate and Duration.Front Neurosci. 2017 Jul 27;11:429. doi: 10.3389/fnins.2017.00429. eCollection 2017. Front Neurosci. 2017. PMID: 28798660 Free PMC article.
-
Techniques for Obtaining High-quality Recordings in Electrocochleography.Front Syst Neurosci. 2020 Apr 15;14:18. doi: 10.3389/fnsys.2020.00018. eCollection 2020. Front Syst Neurosci. 2020. PMID: 32351368 Free PMC article.
-
Contralateral Inhibition of Click- and Chirp-Evoked Human Compound Action Potentials.Front Neurosci. 2017 Apr 4;11:189. doi: 10.3389/fnins.2017.00189. eCollection 2017. Front Neurosci. 2017. PMID: 28420960 Free PMC article.
References
-
- Brown DJ, Gibson WP. On the differential diagnosis of Ménière's disease using low-frequency acoustic biasing of the 2f1-f2 DPOAE. Hear Res. 2011;282(1–2):119–127. - PubMed
-
- Carhart R, Jerger J. Preferred method for clinical determination of pure-tone thresholds. J Speech Hear Dis. 1959
-
- Ferraro JA, Ferguson R. Tympanic ECochG and conventional ABR: a combined approach for the identification of wave I and the IV interwave interval. Ear Hear. 1989;10(3):161–166. - PubMed
MeSH terms
Grants and funding
LinkOut - more resources
Full Text Sources
Other Literature Sources
Miscellaneous
