

A Development of Nucleic Chromatin Measurements as a New Prognostic Marker for Severe Chronic Heart Failure
- PMID: 26845691
- PMCID: PMC4742272
- DOI: 10.1371/journal.pone.0148209
A Development of Nucleic Chromatin Measurements as a New Prognostic Marker for Severe Chronic Heart Failure
Abstract
Background: Accurate prediction of both mortality and morbidity is of significant importance, but it is challenging in patients with severe heart failure. It is especially difficult to detect the optimal time for implanting mechanical circulatory support devices in such patients. We aimed to analyze the morphometric ultrastructure of nuclear chromatin in cardiomyocytes by developing an original clinical histopathological method. Using this method, we developed a biomarker to predict poor outcome in patients with dilated cardiomyopathy (DCM).
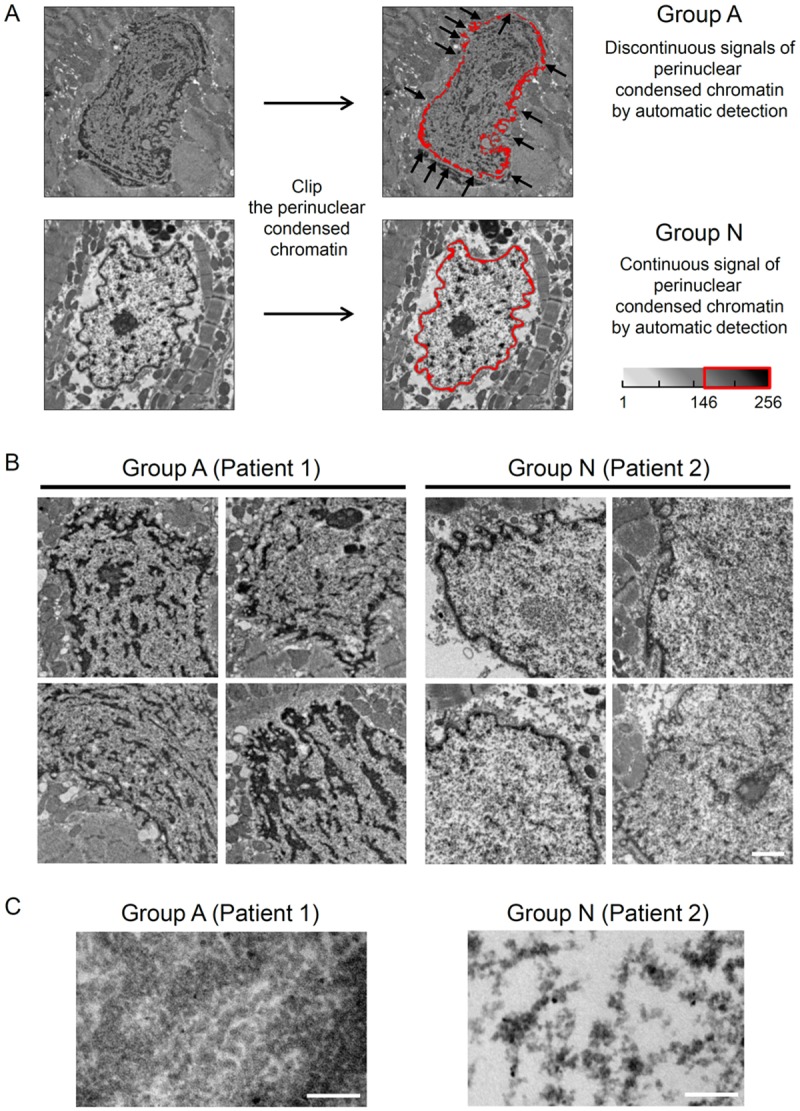
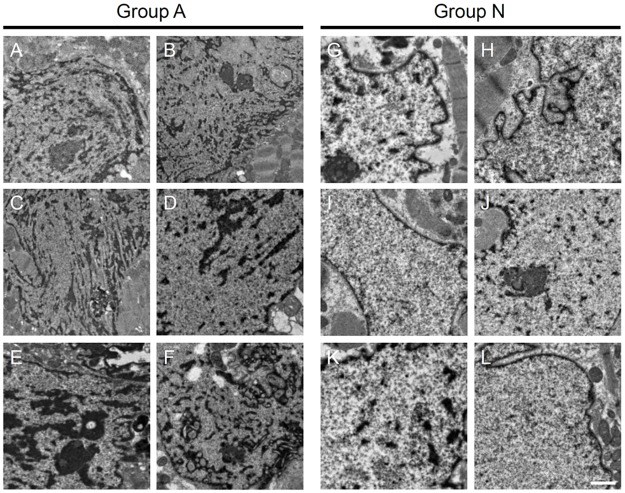
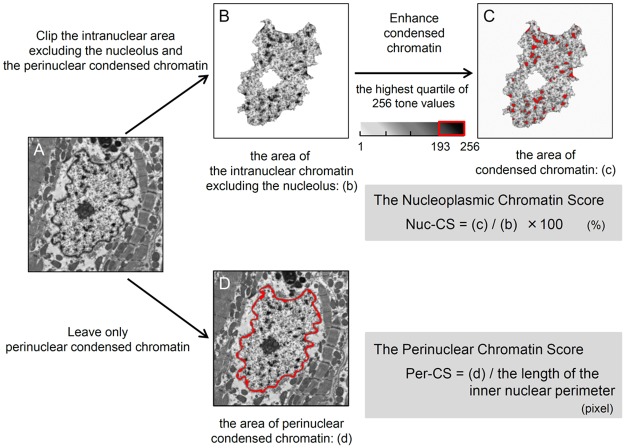
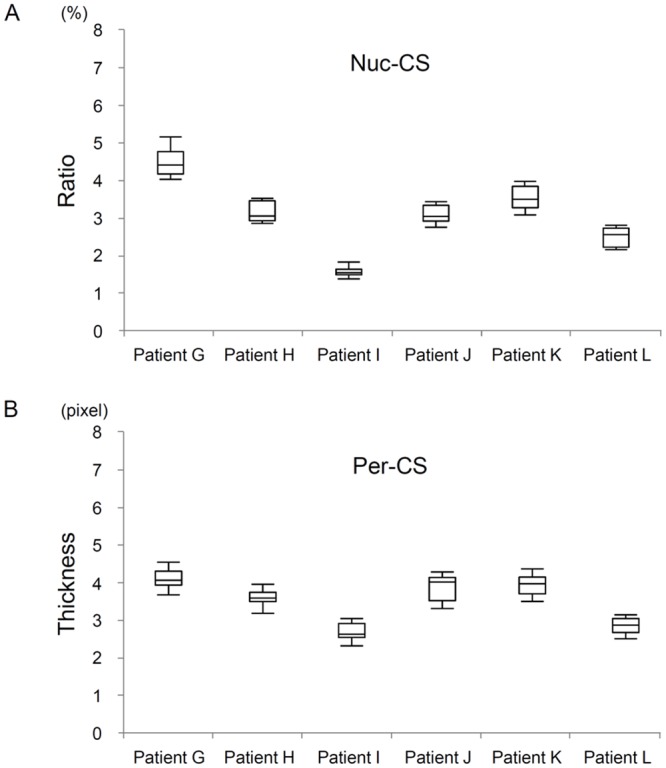
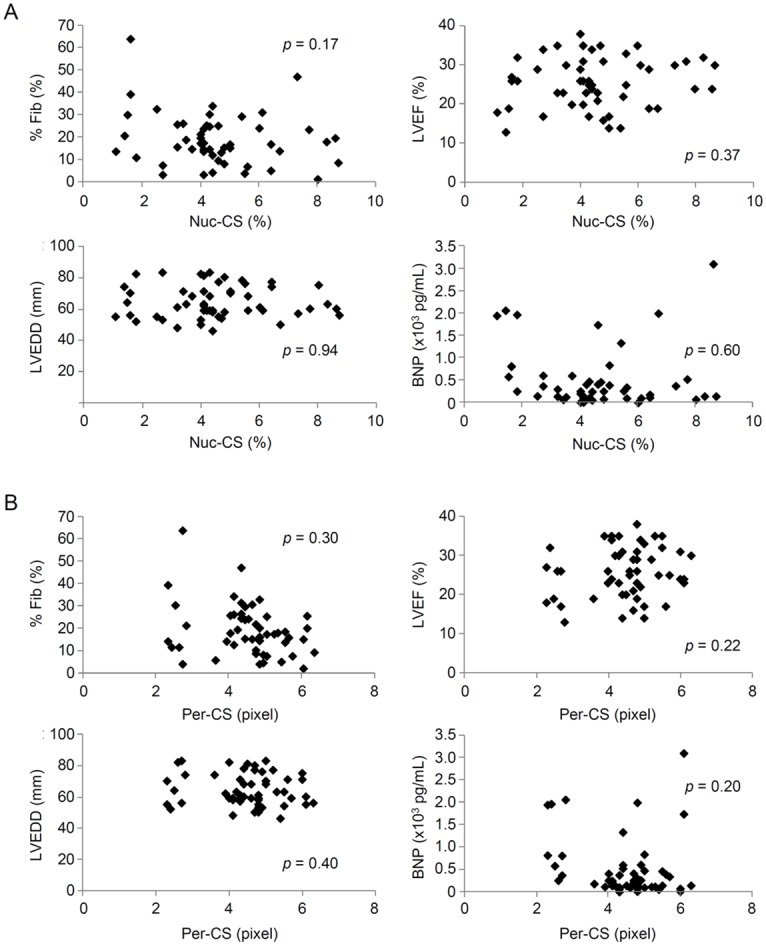
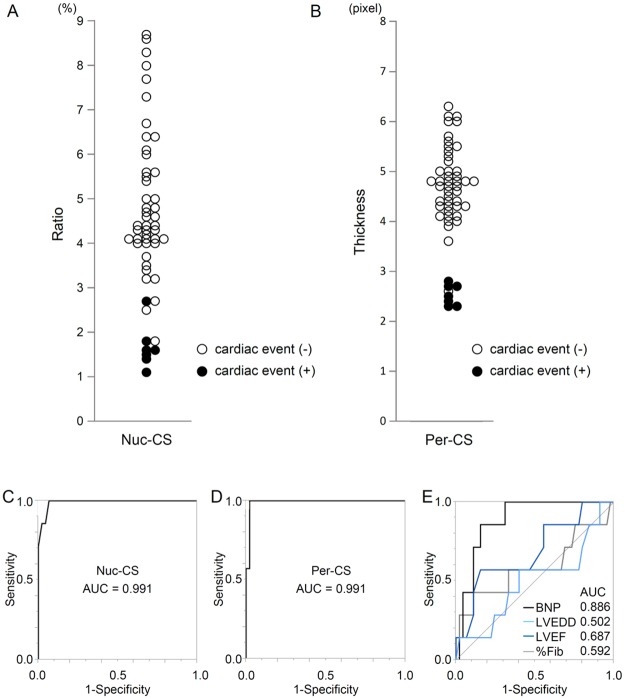
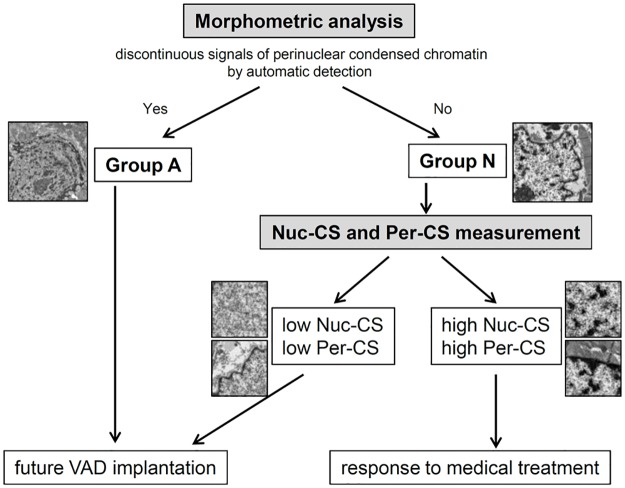
Methods and results: As a part of their diagnostic evaluation, 171 patients underwent endomyocardial biopsy (EMB). Of these, 63 patients diagnosed with DCM were included in this study. We used electron microscopic imaging of cardiomyocyte nuclei and an automated image analysis software program to assess whether it was possible to detect discontinuity of the nuclear periphery. Twelve months after EMB, all patients with a discontinuous nuclear periphery (Group A, n = 11) died from heart failure or underwent left ventricular assist device (VAD) implantation. In contrast, in patients with a continuous nuclear periphery (Group N, n = 52) only 7 patients (13%) underwent VAD implantation and there were no deaths (p<0.01). We then evaluated chromatin particle density (Nuc-CS) and chromatin thickness in the nuclear periphery (Per-CS) in Group N patients; these new parameters were able to identify patients with poor prognosis.
Conclusions: We developed novel morphometric methods based on cardiomyocyte nuclear chromatin that may provide pivotal information for early prediction of poor prognosis in patients with DCM.
Conflict of interest statement
Figures
Similar articles
-
Prediction of cardiac stability after weaning from left ventricular assist devices in patients with idiopathic dilated cardiomyopathy.Circulation. 2008 Sep 30;118(14 Suppl):S94-105. doi: 10.1161/CIRCULATIONAHA.107.755983. Circulation. 2008. PMID: 18824777
-
The Role of Serum Adiponectin for Outcome Prediction in Patients with Dilated Cardiomyopathy and Advanced Heart Failure.Biomed Res Int. 2017;2017:3818292. doi: 10.1155/2017/3818292. Epub 2017 Nov 26. Biomed Res Int. 2017. PMID: 29318144 Free PMC article. Clinical Trial.
-
Biventricular circulatory support with two miniaturized implantable assist devices.Circulation. 2011 Sep 13;124(11 Suppl):S179-86. doi: 10.1161/CIRCULATIONAHA.110.011502. Circulation. 2011. PMID: 21911810
-
[Surgical therapy of end-stage heart failure. State of the art 2006].Herz. 2006 Aug;31(5):445-54. doi: 10.1007/s00059-006-2840-8. Herz. 2006. PMID: 16944064 Review. German.
-
Diagnostic biomarkers of dilated cardiomyopathy.Immunobiology. 2021 Nov;226(6):152153. doi: 10.1016/j.imbio.2021.152153. Epub 2021 Nov 8. Immunobiology. 2021. PMID: 34784575 Review.
Cited by
-
Myocardial ultrastructure can augment genetic testing for sporadic dilated cardiomyopathy with initial heart failure.ESC Heart Fail. 2021 Dec;8(6):5178-5191. doi: 10.1002/ehf2.13596. Epub 2021 Sep 6. ESC Heart Fail. 2021. PMID: 34486814 Free PMC article.
-
Electron microscopic findings predict clinical outcomes in patients with non-ischaemic cardiomyopathy.ESC Heart Fail. 2025 Aug;12(4):2441-2449. doi: 10.1002/ehf2.15255. Epub 2025 Mar 2. ESC Heart Fail. 2025. PMID: 40024884 Free PMC article.
-
Increased oxidative stress during exercise predicts poor prognosis in patients with acute decompensated heart failure.ESC Heart Fail. 2021 Oct;8(5):3885-3893. doi: 10.1002/ehf2.13538. Epub 2021 Jul 29. ESC Heart Fail. 2021. PMID: 34327841 Free PMC article.
-
Clinical Outcomes of Autologous Stem Cell-Patch Implantation for Patients With Heart Failure With Nonischemic Dilated Cardiomyopathy.J Am Heart Assoc. 2021 Jul 6;10(13):e008649. doi: 10.1161/JAHA.117.008649. Epub 2021 Jul 2. J Am Heart Assoc. 2021. PMID: 34212772 Free PMC article. Clinical Trial.
-
Enhanced nuclear localization of phosphorylated MLKL predicts adverse events in patients with dilated cardiomyopathy.ESC Heart Fail. 2022 Oct;9(5):3435-3451. doi: 10.1002/ehf2.14059. Epub 2022 Jul 18. ESC Heart Fail. 2022. PMID: 35851586 Free PMC article.
References
-
- Seidman JG, Seidman C. The genetic basis for cardiomyopathy: from mutation identification to mechanistic paradigms. Cell. 2001. February 23;104(4):557–67. - PubMed
-
- Towbin JA, Bowles NE. The failing heart. Nature. 2002. January 10;415(6868):227–33. - PubMed
-
- Nohria A, Lewis E, Stevenson LW. Medical management of advanced heart failure. JAMA. 2002. February 6;287(5):628–40. - PubMed
-
- Rose EA, Gelijns AC, Moskowitz AJ, Heitjan DF, Stevenson LW, Dembitsky W, et al. Long-term use of a left ventricular assist device for end-stage heart failure. The New England journal of medicine. 2001. November 15;345(20):1435–43. - PubMed
Publication types
MeSH terms
Substances
LinkOut - more resources
Full Text Sources
Other Literature Sources
Medical
Research Materials
Miscellaneous
