

Parvovirus B19 Replication and Expression in Differentiating Erythroid Progenitor Cells
- PMID: 26845771
- PMCID: PMC4742074
- DOI: 10.1371/journal.pone.0148547
Parvovirus B19 Replication and Expression in Differentiating Erythroid Progenitor Cells
Abstract
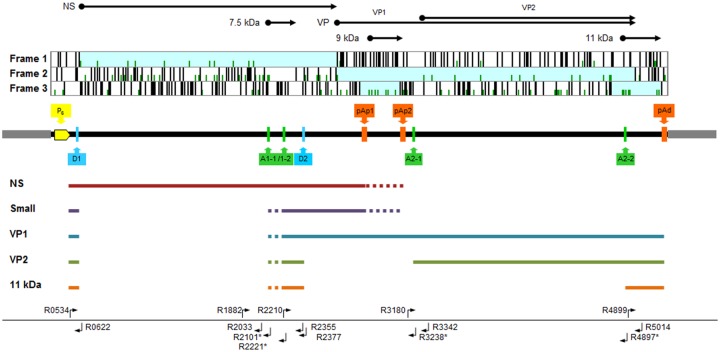
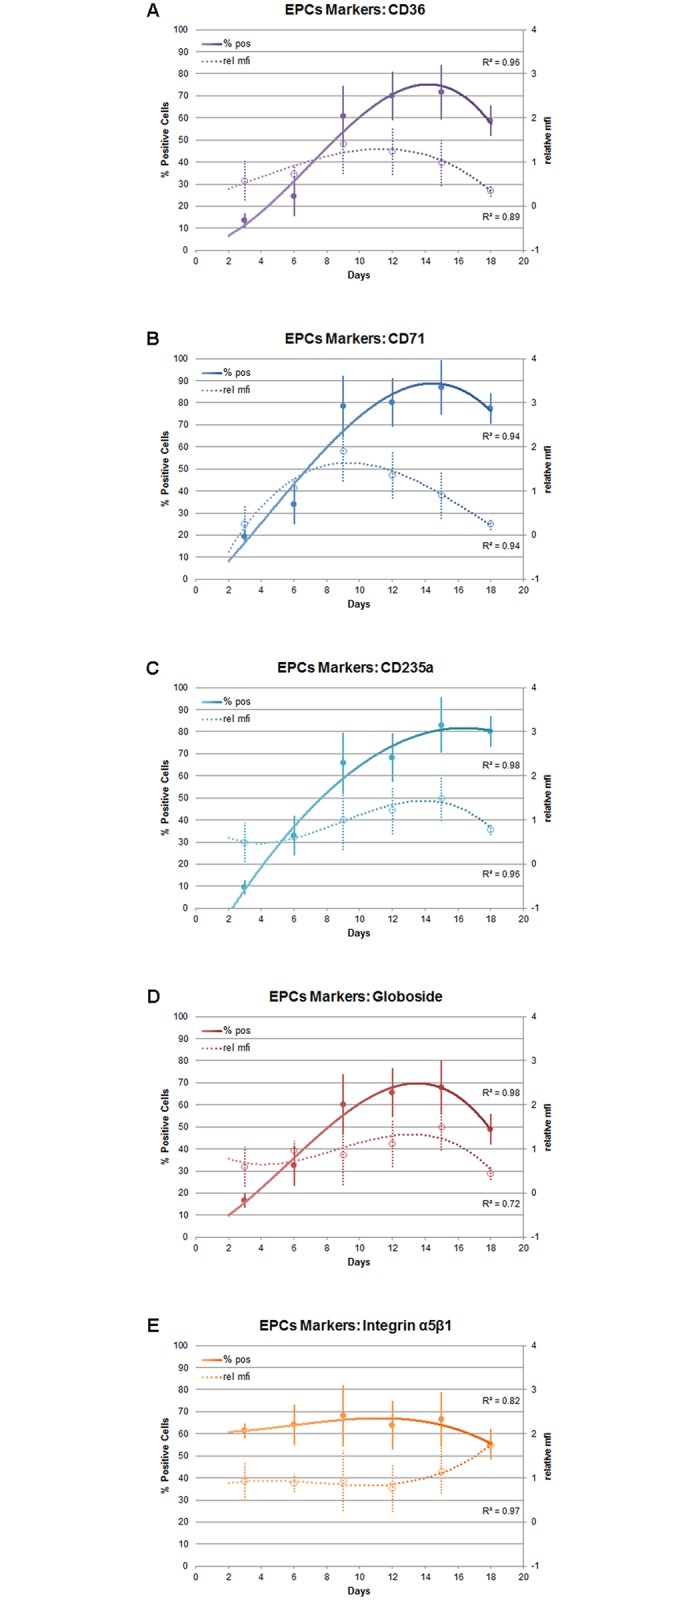
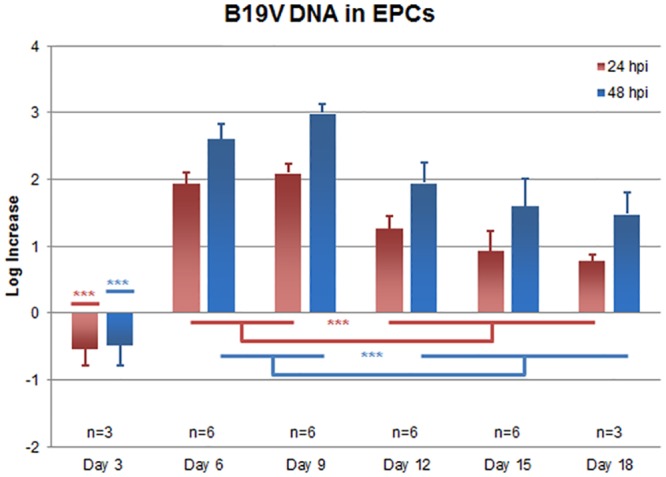
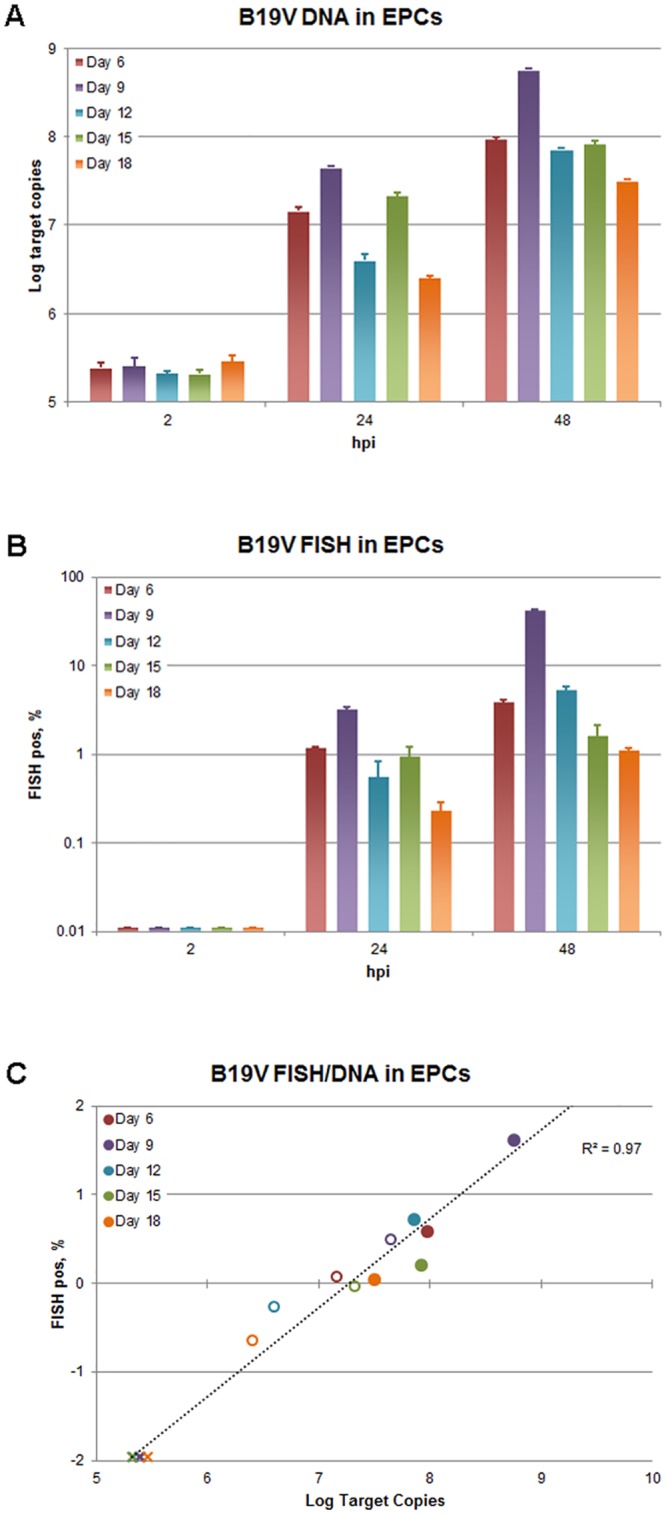
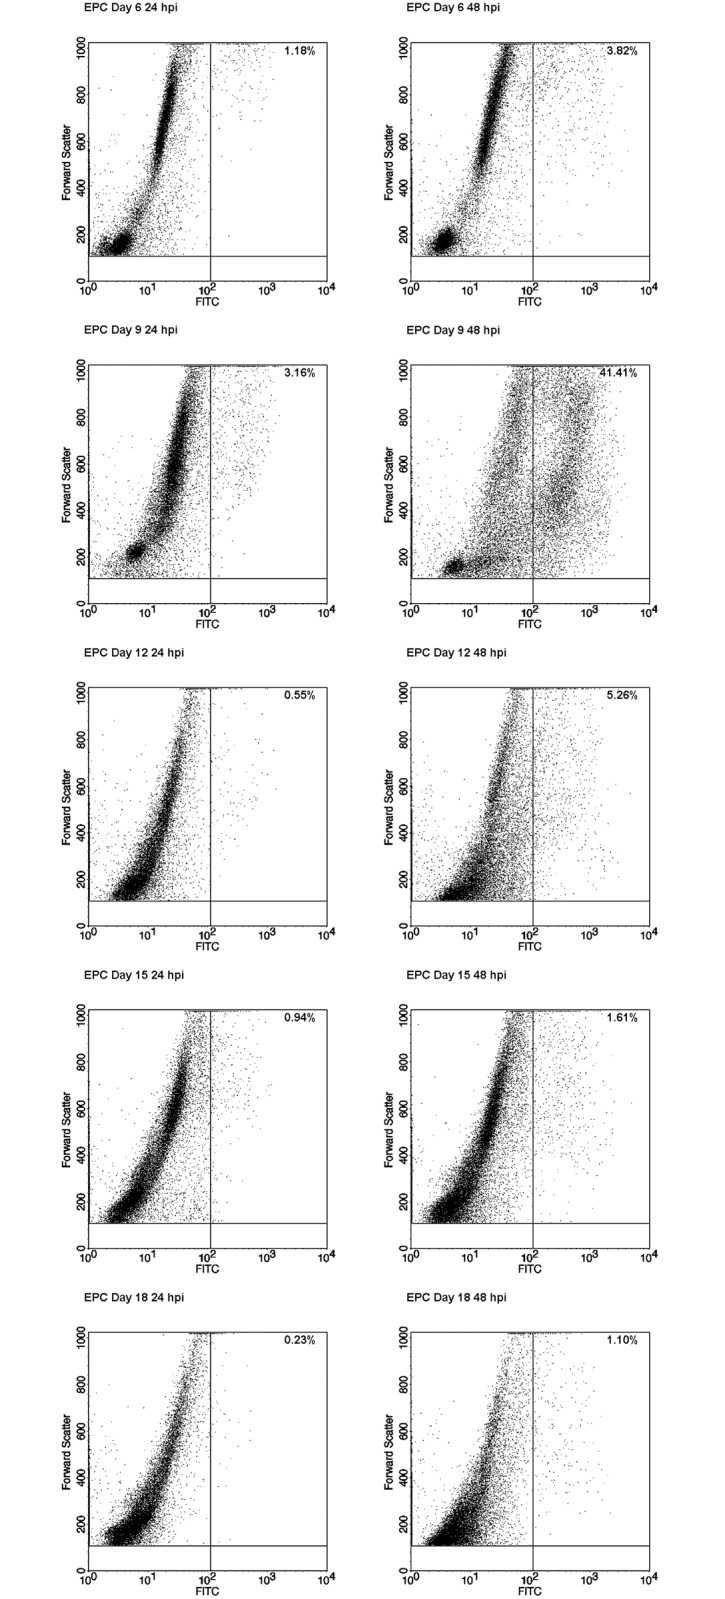
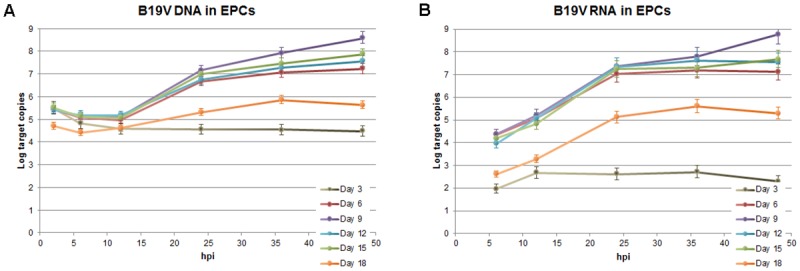
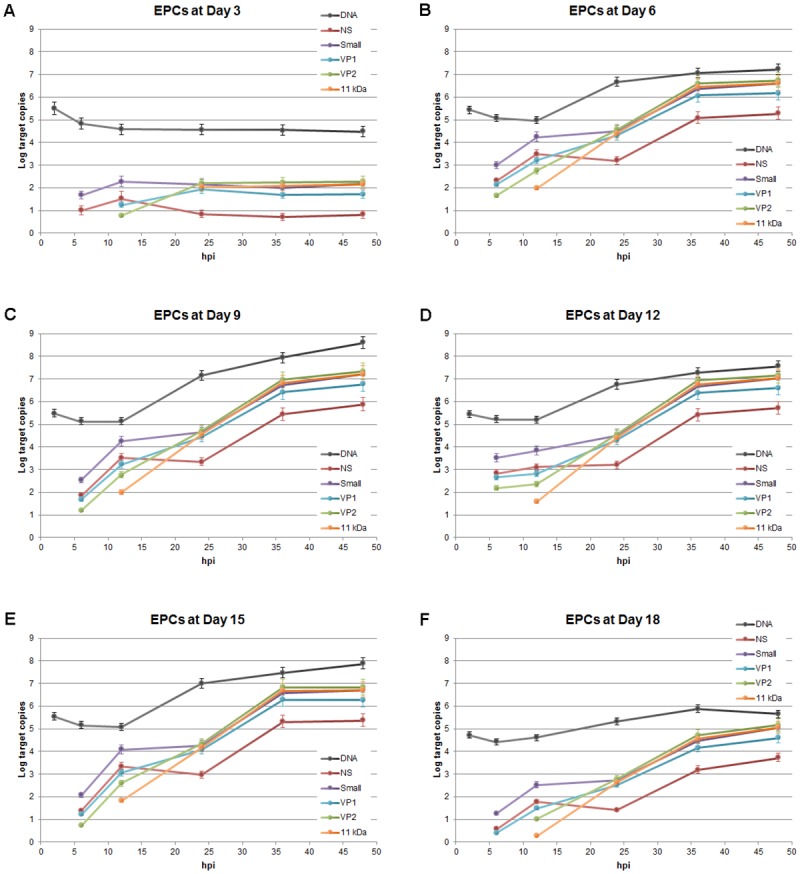
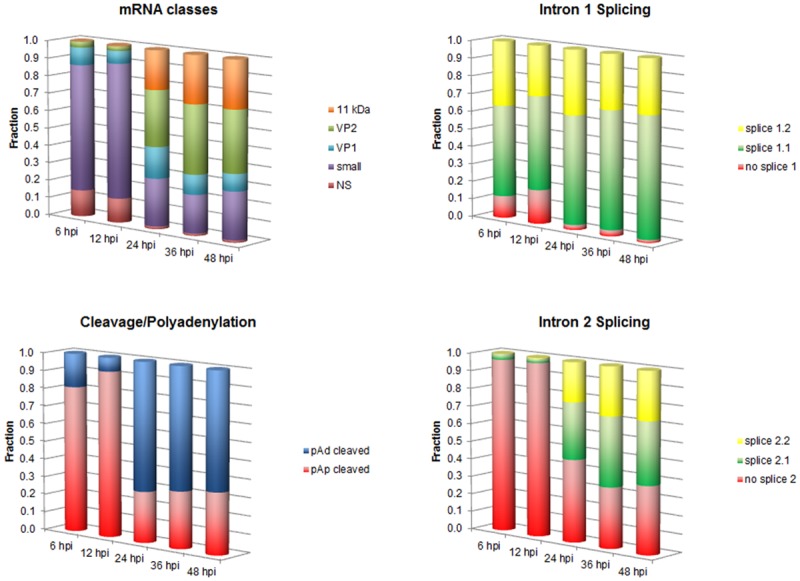
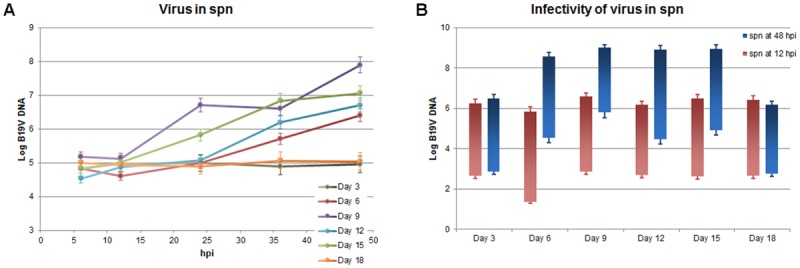
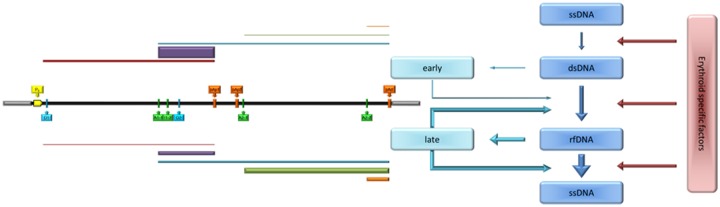
The pathogenic Parvovirus B19 (B19V) is characterized by a strict adaptation to erythroid progenitor cells (EPCs), a heterogeneous population of differentiating cells with diverse phenotypic and functional properties. In our work, we studied the dynamics of B19V infection in EPCs in dependence on the cell differentiation stage, in terms of distribution of infected cells, synthesis of viral nucleic acids and production of infectious virus. EPCs at early differentiation stage led to an abortive infection, without viral genome replication and a very low transcriptional activity. EPCs at later stages were permissive, with highest levels of viral replicative activity at day 9 (+3.0 Log from 2 to 48 hpi) and lower levels at day 18 (+1.5 Log from 2 to 48 hpi). B19V DNA increment was in accordance with the percentage of cells positive to flow-FISH assay (41.4% at day 9, 1.1% at day 18). Quantitation of total RNA indicated a close association of genome replication and transcription with viral RNA accumulation within infected cells related to viral DNA increase during the course of infection. Analysis of the different classes of mRNAs revealed two distinct pattern of genome expression profile with a fine regulation in the frequency utilization of RNA processing signals: an early phase, when cleavage at the proximal site leading to a higher relative production of mRNA for NS protein, and a late phase, when cleavage at the distal site was more frequent leading to higher relative abundance of mRNA for VP and 11 kDA proteins. Infectious virus was released from cells at day 6-15, but not at day 18. Our results, providing a detailed description of B19V replication and expression profile in differentiating EPCs, highlight the very tight adaptation of B19V to a specific cellular target defined both by its erythroid lineage and its differentiation stage.
Conflict of interest statement
Figures
Similar articles
-
Recent Advances in Replication and Infection of Human Parvovirus B19.Front Cell Infect Microbiol. 2018 Jun 5;8:166. doi: 10.3389/fcimb.2018.00166. eCollection 2018. Front Cell Infect Microbiol. 2018. PMID: 29922597 Free PMC article. Review.
-
Human Parvovirus B19 Utilizes Cellular DNA Replication Machinery for Viral DNA Replication.J Virol. 2018 Feb 12;92(5):e01881-17. doi: 10.1128/JVI.01881-17. Print 2018 Mar 1. J Virol. 2018. PMID: 29237843 Free PMC article.
-
RNA Binding Protein RBM38 Regulates Expression of the 11-Kilodalton Protein of Parvovirus B19, Which Facilitates Viral DNA Replication.J Virol. 2018 Mar 28;92(8):e02050-17. doi: 10.1128/JVI.02050-17. Print 2018 Apr 15. J Virol. 2018. PMID: 29437973 Free PMC article.
-
Ex vivo-generated CD36+ erythroid progenitors are highly permissive to human parvovirus B19 replication.J Virol. 2008 Mar;82(5):2470-6. doi: 10.1128/JVI.02247-07. Epub 2007 Dec 26. J Virol. 2008. PMID: 18160440 Free PMC article.
-
Persistent parvovirus B19 infection in non-erythroid tissues: possible role in the inflammatory and disease process.Virus Res. 2014 Sep 22;190:8-16. doi: 10.1016/j.virusres.2014.06.017. Epub 2014 Jul 3. Virus Res. 2014. PMID: 24998884 Review.
Cited by
-
Evaluation of Molecular Test for the Discrimination of "Naked" DNA from Infectious Parvovirus B19 Particles in Serum and Bone Marrow Samples.Viruses. 2022 Apr 18;14(4):843. doi: 10.3390/v14040843. Viruses. 2022. PMID: 35458573 Free PMC article.
-
Non-Permissive Parvovirus B19 Infection: A Reservoir and Questionable Safety Concern in Mesenchymal Stem Cells.Int J Mol Sci. 2023 May 3;24(9):8204. doi: 10.3390/ijms24098204. Int J Mol Sci. 2023. PMID: 37175911 Free PMC article.
-
Enhanced Cell-Based Detection of Parvovirus B19V Infectious Units According to Cell Cycle Status.Viruses. 2020 Dec 18;12(12):1467. doi: 10.3390/v12121467. Viruses. 2020. PMID: 33353185 Free PMC article.
-
Human parvovirus B19 interacts with globoside under acidic conditions as an essential step in endocytic trafficking.PLoS Pathog. 2021 Apr 20;17(4):e1009434. doi: 10.1371/journal.ppat.1009434. eCollection 2021 Apr. PLoS Pathog. 2021. PMID: 33878123 Free PMC article.
-
Possible risks posed by single-stranded DNA viruses of pigs associated with xenotransplantation.Xenotransplantation. 2018 Jul;25(4):e12453. doi: 10.1111/xen.12453. Xenotransplantation. 2018. PMID: 30264878 Free PMC article. Review.
References
-
- Young NS, Brown KE (2004) Parvovirus B19. N Engl J Med 350: 586–597. - PubMed
-
- Gallinella G (2013) Parvovirus B19 Achievements and Challenges. ISRN Virology: 10.5402/2013/898730 - DOI
-
- Chisaka H, Morita E, Yaegashi N, Sugamura K (2003) Parvovirus B19 and the pathogenesis of anaemia. Rev Med Virol 13: 347–359. - PubMed
-
- Brown KE (2000) Haematological consequences of parvovirus B19 infection. Baillieres Best Pract Res Clin Haematol 13: 245–259. - PubMed
MeSH terms
Substances
LinkOut - more resources
Full Text Sources
Other Literature Sources
Miscellaneous
