. 2016 Feb 5:6:20588.
doi: 10.1038/srep20588.

Stem cell-derived tissue-associated regulatory T cells ameliorate the development of autoimmunity

Affiliations

Stem cell-derived tissue-associated regulatory T cells ameliorate the development of autoimmunity

Mohammad Haque et al. Sci Rep. .

Abstract

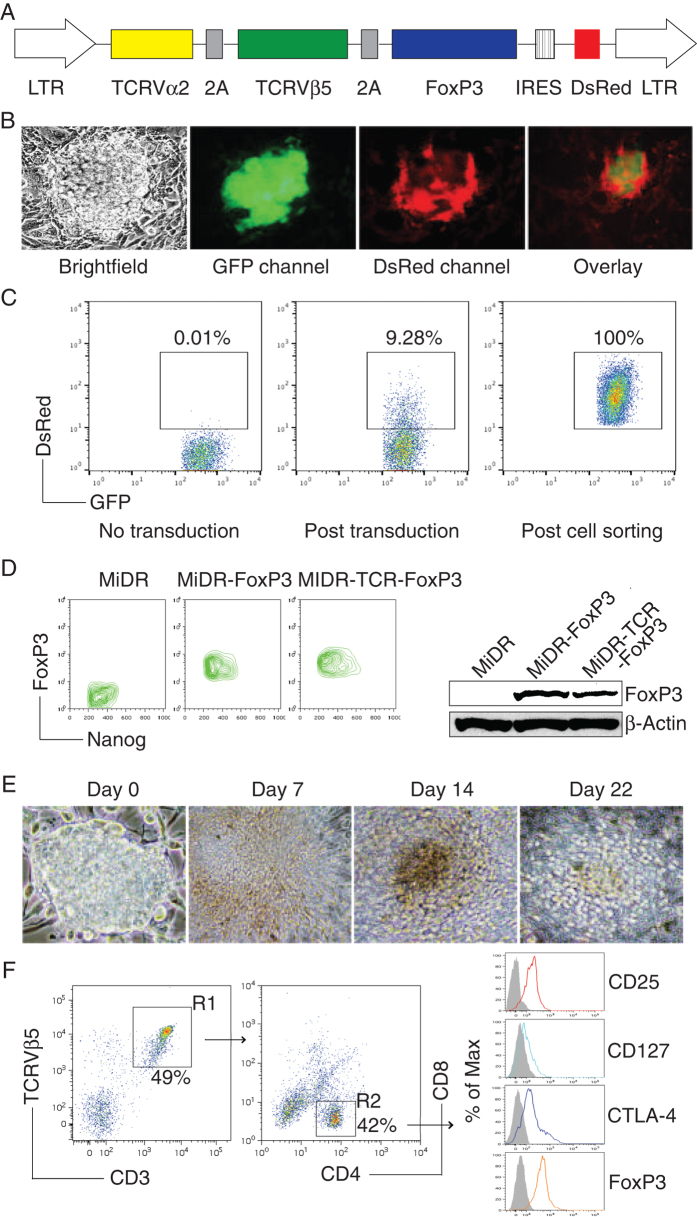
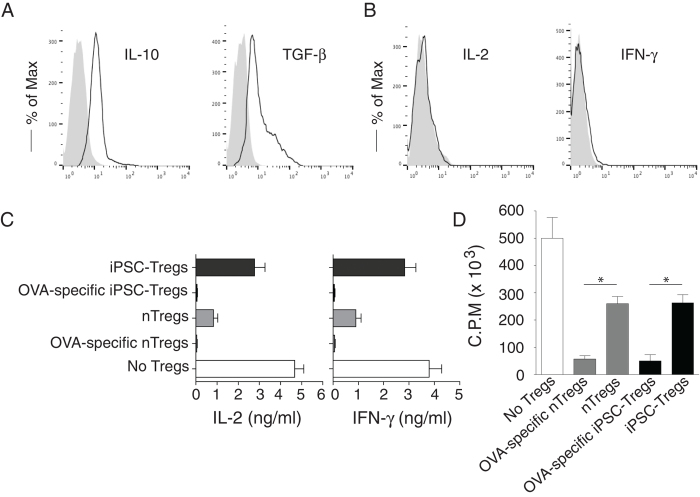
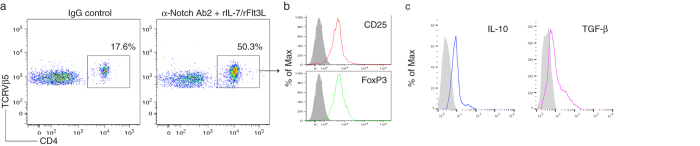
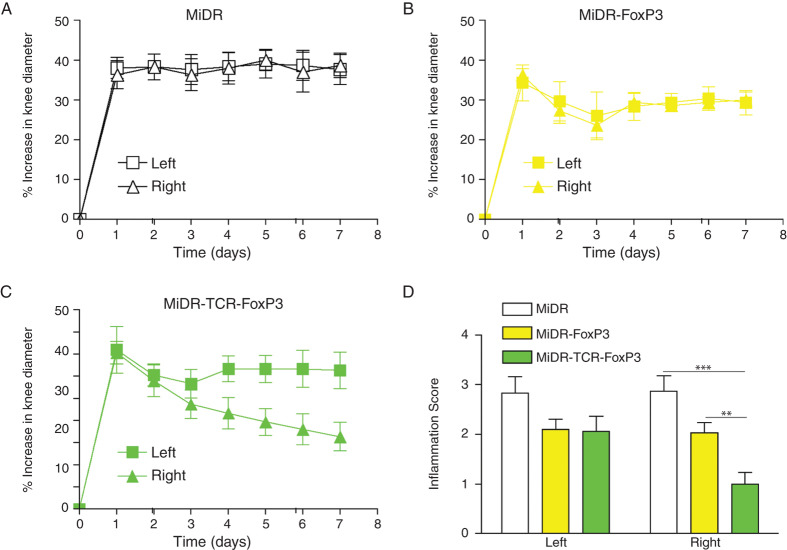
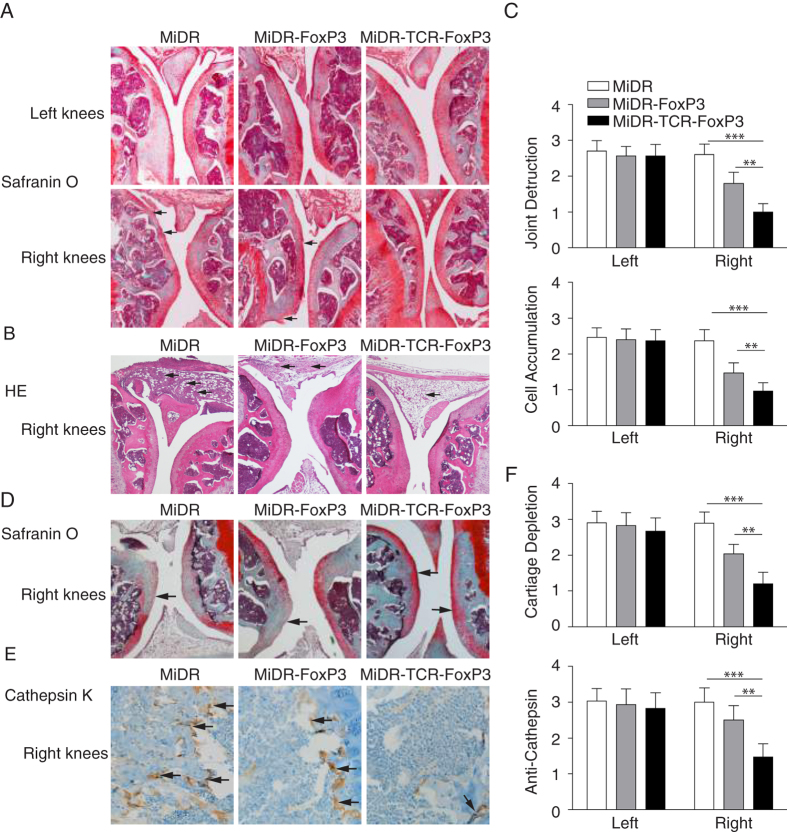
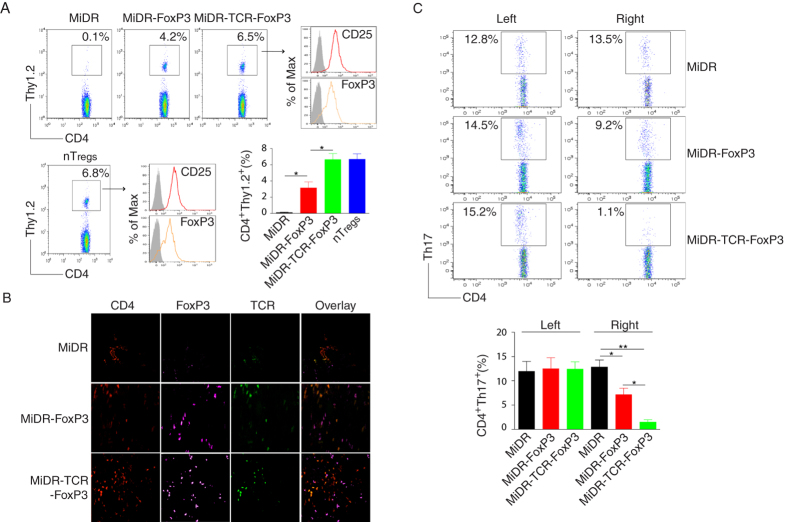
Pluripotent stem cells (PSCs) have the potential to produce almost all of the cells in the body, including regulatory T cells (Tregs). However, the exact conditions required for the development of antigen (Ag)-specific Tregs from PSCs (i.e., PSC-Tregs) are not well delineated. Ag-specific PSC-Tregs can be tissue/organ-associated and migrate to local inflamed tissues/organs to suppress the autoimmune response after adoptive transfer, thereby avoiding potential overall immunosuppression from non-specific Tregs. In this study, we developed a new approach to generate functional Ag-specific Tregs from induced PSCs (iPSCs), i.e., iPSC-Tregs, which had the ability to generate an Ag-specific immunosuppressive response in a murine model of arthritis. We retrovirally transduced murine iPSCs with a construct containing genes of Ag-specific T cell receptor (TCR) and the transcriptional factor FoxP3. We differentiated the iPSCs into Ag-specific iPSC-Tregs using in vitro or in vivo Notch signaling, and demonstrated that adoptive transfer of such Tregs dramatically suppressed autoimmunity in a well-established Ag-induced arthritis model, including the inflammation, joint destruction, cartilage prostaglandin depletion, osteoclast activity, and Th17 production. Our results indicate that PSCs can be used to develop Ag-specific Tregs, which have a therapeutic potential for Treg-based therapies of autoimmune disorders.


Figures

Figure 1
Figure 1. In vitro programming of Ag-specific iPSC-Tregs.
(A) Schematic representation of the retrovirus construct MiDR-TCR-FoxP3 expressing OVA-specific TCR and FoxP3. Ψ, packaging signal; 2A, picornavirus self-cleaving 2A sequence; LTR, Long terminal repeats. (B) The TCR/FoxP3 gene-transduced iPSCs were visualized by fluorescence microscopy. (C) GFP+ iPSCs (left) were transduced with the retroviral construct MiDR-TCR-FoxP3 and GFP+DsRed+ iPSCs (middle) were analyzed by Flow Cytometry and sorted by a high speed cell sorter (Right). (D) The GFP+DsRed+ iPSCs were analyzed for the expression of FoxP3 and Nanog by intracellular staining. Data are representative of three independent experiments (left). The GFP+DsRed+ iPSCs were analyzed using Western blotting (right). Data are representative of three independent experiments. (E) Morphology of Tregs cell differentiation on day 0, 7, 14 and 22. (F) Flow cytometric analysis for the protein expression of iPSC-derived cells on day 28. CD3+ TCRVβ5+ cells were gated as indicated (R1), and analyzed for the expression of CD4 and CD8, with CD25, CD127, CTLA-4, and FoxP3 shown for cells gated as CD4+CD8- cells (R2) (dark lines; shaded areas indicate isotype controls). Data are representative of three experiments.
Figure 2
Figure 2. Functional analyses of Ag-specific iPSC-Tregs.
On day 28 of in vitro co-culture, the SP CD4+TCRβ5+ iPSC-Tregs were sorted and stimulated by T-depleted splenocytes (APCs; Tregs/APCs = 1:4) pulsed with OVA323-339 peptide (A,B), or mixed with naive CD4+ T cells (CD4+ CD25-) from OT-II TCR Tg mice (Tregs/T cells = 1:10) and then stimulated by the APCs pulsed with OVA323-339 peptide for 2 days (C,D). The proliferation and cytokine production were assessed. For suppressive assays (C,D), a group of CD4+ T cells stimulated with OVA-specific nTregs (CD4+ CD25+) from OT-II TCR Tg mice and a group of CD4+ T cells stimulated with non-specific nTregs (CD4+ CD25+) from C57BL/6 mice as positive controls, and a group of CD4+ T cells stimulated without Tregs as the negative control. Intracellular cytokine production (IL-10, IL-2, and IFN-γ) or surface LAP (TGF-β) was analyzed by flow cytometry after gating on live CD4+ CD25+ cells (dark lines; shaded areas indicate isotype controls) or by ELISA, and proliferation was determined by [3H] thymidine incorporation. (A) Intracellular IL-10 and surface TGF-β. (B) Intracellular IL-2 and IFN-γ. (C) IL-2 and IFN-γ production were measured by ELISA at 40 h. Data are representative of three experiments. (D) Thymidine incorporation during the last 12 hrs. Data are representative of three experiments. *P < 0.05, one-way ANOVA tests.
Figure 3
Figure 3. In vivo programming of Ag-specific iPSC-Tregs.
The iPSCs transduced with the MiDR-TCR-FoxP3 were co-cultured with the OP9-DL1/DL4/I-Ab cells in the presence of murine rFlt3L and rIL-7. On day 7, the DsRed+ cells were sorted were adoptively transferred into Thy1.1 congenic mice and in the following days, mice were i.p. injected with 0.25 mg agonistic α-Notch2 Ab, 5 μg mouse rIL-7 and 10 μg mouse rFlt3L or a mouse IgG/PBS control twice a week. (a) After 2 weeks, CD4+ TCRVβ5+ cells from the pooled lymph nodes and spleen were analyzed by flow cytometry, after gating on Thy1.2+ cell population. (b) The expression of CD25 and FoxP3 was analyzed by flow cytometry, after gating on CD4+ Thy1.2+ TCRVβ5+ T cells from the pooled lymph nodes and spleen (dark lines; shaded areas indicate isotype controls). Data are representative of three independent experiments. (c) IL-10 and TGF-β production (dark lines; shaded areas indicate isotype controls). The pooled lymph nodes and spleen were stimulated with OVA323-339 peptide and analyzed by intracellular IL-10 or surface TGF-β (LAP) staining, after gating on Thy1.2+ TCRVβ5+ cells. Data are representative of three independent experiments.
Figure 4
Figure 4. Ag-specific iPSC-Tregs ameliorate Ag-induced arthritis (AIA).
Murine iPSCs transduced with the retroviral construct MiDR, MiDR-FoxP3, or MiDR-TCR-FoxP3 and were co-cultured on the OP9-DL1/DL4/I-Ab cells. On day 7, the gene-transduced cells (3 × 106/mouse) were adoptively transferred into female C57BL/6 mice that were induced AIA two weeks later after the cell transfer. On the following day of arthritis induction, the arthritis severity was monitored by measurement of the knee diameter. (A–C) % increase in knee diameter. Increase in knee diameter was calculated based on preinjection knee diameter for each mouse before injection on day 0. Arthritis score was evaluated by examining the both knees by a blinded manner and each knee was assigned a score, as follows: 0, no visible swelling or discoloration; 1, visible swelling with or without discoloration; 2, moderate swelling with discoloration; 3, severe swelling with discoloration. In each group five mice were used and data are representative of three independent experiments. Data are represented as the mean ± SD. (D) The mean scoring on day 7 for both knees from five mice. Data are represented as the mean ± SD from three independent experiments (**p < 0.01, ***p < 0.001, two-way ANOVA).
Figure 5
Figure 5. Adoptive transfer of Ag-specific iPSC-Tregs ameliorates joint destruction, reduces inflammation and cartilage depletion, and prevents osteoclast-like activity.
On day 7 following the arthritis induction, the knees were removed, sectioned and stained with Safranin O, HE, and Cathepsin K for joint destruction, cellular infiltration, cartilage depletion, and osteoclast-like activity. (A) Representative photomicrographs of both knees by Safranin O staining. Losses of cartilage and joint destruction (↑) of the right knees are indicated. (B) Representative photomicrographs of the right knees by HE staining. Cellular infiltrations (↑) are indicated. Data are representative of five mice per group in three independent experiments. (C) Quantitation of joint destruction and cell accumulation from sections of 5 individual knees in each group. Data are represented as the mean ± SD from three independent experiments (*p < 0.05, two-way ANONA). (D) Safranin O staining for cartilage depletion. Cartilage depletions (↑) are indicated. (E) Cathepsin K staining for osteoclast-like activity. The multinucleated osteoclasts (↑) are indicated. (F) Quantitation of cartilage depletion and osteoclast-like activity from sections of 5 individual knees in each group (*p < 0.05, two-way ANOVA).
Figure 6
Figure 6. Ag-specific iPSC-Tregs infiltrate into the knee joints, maintain the Treg phenotype in vivo, and suppress AIA by reducing the local number of Th17 producing cells.
(A) The iPSC-Tregs or nTregs (CD4+ CD25+) from OT-II TCR Tg mice (Thy 1.2+) were adoptively transferred into C57BL/6 congenic mice (Thy1.1+) with AIA. Six weeks later, mice were sacrificed and the popliteal lymph nodes from the inflammatory right side were analyzed for CD4+ Thy 1.2+ cells. Data are representative of three independent experiments. The mean ± SD from three independent experiments is shown (*p < 0.05, one-way ANONA). (B) On days 7-14 after arthritis induction, the knees were removed and stained for immunohistology with CD4, FoxP3, and TCRVβ5. Data are representative of five mice per group in three independent experiments. (C) On day 14 after arthritis induction, mice were sacrificed and the popliteal lymph nodes were removed from both sides, and the cells were analyzed for intracellular IL-17 staining, gating on CD4+ populations. Data are representative of three independent experiments. The mean ± SD from three independent experiments is shown (*p < 0.05, **p < 0.01, one-way ANOVA).

Similar articles

Cited by

References

    1. Huynh A. et al. Control of PI(3) kinase in Treg cells maintains homeostasis and lineage stability. Nat Immunol 16, 188–196 (2015). - PMC - PubMed
    1. Liu Y. et al. Two histone/protein acetyltransferases, CBP and p300, are indispensable for Foxp3+ T-regulatory cell development and function. Mol Cell Biol 34, 3993–4007 (2014). - PMC - PubMed
    1. Baca Jones C. et al. Regulatory T cells control diabetes without compromising acute anti-viral defense. Clin Immunol 153, 298–307 (2014). - PMC - PubMed
    1. Wing J. B., Ise W., Kurosaki T. & Sakaguchi S. Regulatory T Cells Control Antigen-Specific Expansion of Tfh Cell Number and Humoral Immune Responses via the Coreceptor CTLA-4. Immunity 41, 1013–1025 (2014). - PubMed
    1. Maeda Y. et al. Detection of self-reactive CD8(+) T cells with an anergic phenotype in healthy individuals. Science 346, 1536–1540 (2014). - PubMed

Publication types

MeSH terms

Substances