

Multimodality hard-x-ray imaging of a chromosome with nanoscale spatial resolution
- PMID: 26846188
- PMCID: PMC4742846
- DOI: 10.1038/srep20112
Multimodality hard-x-ray imaging of a chromosome with nanoscale spatial resolution
Abstract
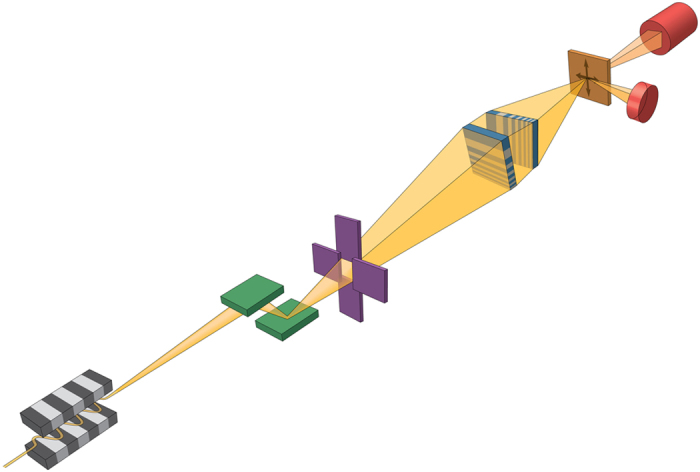
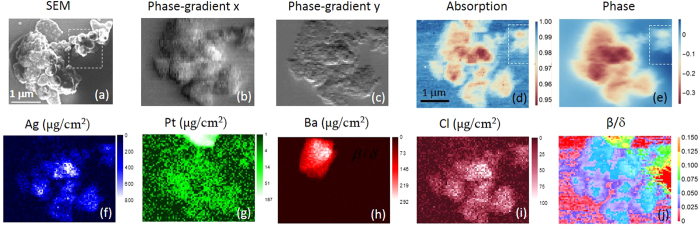
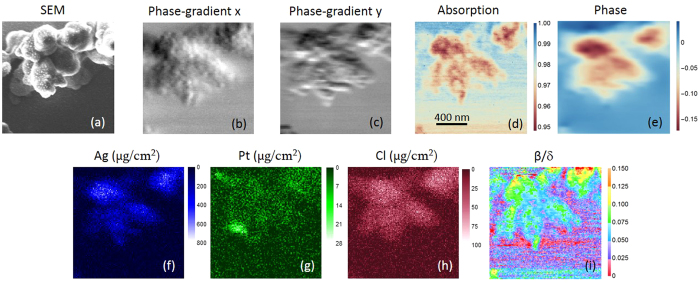
We developed a scanning hard x-ray microscope using a new class of x-ray nano-focusing optic called a multilayer Laue lens and imaged a chromosome with nanoscale spatial resolution. The combination of the hard x-ray's superior penetration power, high sensitivity to elemental composition, high spatial-resolution and quantitative analysis creates a unique tool with capabilities that other microscopy techniques cannot provide. Using this microscope, we simultaneously obtained absorption-, phase-, and fluorescence-contrast images of Pt-stained human chromosome samples. The high spatial-resolution of the microscope and its multi-modality imaging capabilities enabled us to observe the internal ultra-structures of a thick chromosome without sectioning it.
Figures
Similar articles
-
X-ray imaging of various biological samples using a phase-contrast hard X-ray microscope.Microsc Res Tech. 2008 Sep;71(9):639-43. doi: 10.1002/jemt.20601. Microsc Res Tech. 2008. PMID: 18454474
-
Two dimensional hard x-ray nanofocusing with crossed multilayer Laue lenses.Opt Express. 2011 Aug 1;19(16):15069-76. doi: 10.1364/OE.19.015069. Opt Express. 2011. PMID: 21934868
-
Staining and embedding of human chromosomes for 3-d serial block-face scanning electron microscopy.Biotechniques. 2014 Dec 1;57(6):302-7. doi: 10.2144/000114236. eCollection 2014 Dec. Biotechniques. 2014. PMID: 25495730
-
Scanning electron microscopy of chromosomes.Methods Cell Biol. 2008;88:451-74. doi: 10.1016/S0091-679X(08)00423-8. Methods Cell Biol. 2008. PMID: 18617047 Review.
-
Accumulating advantages, reducing limitations: multimodal nonlinear imaging in biomedical sciences - the synergy of multiple contrast mechanisms.J Biophotonics. 2013 Dec;6(11-12):887-904. doi: 10.1002/jbio.201300176. Epub 2013 Nov 20. J Biophotonics. 2013. PMID: 24259267 Review.
Cited by
-
Ellipsoidal mirror for two-dimensional 100-nm focusing in hard X-ray region.Sci Rep. 2017 Nov 27;7(1):16408. doi: 10.1038/s41598-017-16468-1. Sci Rep. 2017. PMID: 29180654 Free PMC article.
-
X-ray Fluorescence Nanotomography of Single Bacteria with a Sub-15 nm Beam.Sci Rep. 2018 Sep 7;8(1):13415. doi: 10.1038/s41598-018-31461-y. Sci Rep. 2018. PMID: 30194316 Free PMC article.
-
Microscopy Instrumentation and Nanopositioning at NSLS-II: Current Status and Future Directions.Synchrotron Radiat News. 2018;31(5):3-8. doi: 10.1080/08940886.2018.1506233. Epub 2018 Sep 25. Synchrotron Radiat News. 2018. PMID: 31467463 Free PMC article. No abstract available.
-
Development and testing of a dual-frequency real-time hardware feedback system for the hard X-ray nanoprobe beamline of the SSRF.J Synchrotron Radiat. 2025 Jan 1;32(Pt 1):100-108. doi: 10.1107/S1600577524010208. Epub 2025 Jan 1. J Synchrotron Radiat. 2025. PMID: 39642103 Free PMC article.
-
Nanospectroscopy Captures Nanoscale Compositional Zonation in Barite Solid Solutions.Sci Rep. 2018 Aug 29;8(1):13041. doi: 10.1038/s41598-018-31335-3. Sci Rep. 2018. PMID: 30158629 Free PMC article.
References
-
- Henderson R. The potential and limitations of neutrons, electrons and X-rays for atomic resolution microscopy of unstained biological molecules. Q. Rev. Biophys. 28, 171–193 (1995). - PubMed
-
- Ris H. Stereoscopic Electron Microscopy of Chromosomes in Methods Cell Biol. Vol. 22 (ed Turner James N.) 77–96 (Academic Press, 1981). - PubMed
Publication types
MeSH terms
Substances
LinkOut - more resources
Full Text Sources
Other Literature Sources
