

Ultratrace level determination and quantitative analysis of kidney injury biomarkers in patient samples attained by zinc oxide nanorods
- PMID: 26846189
- PMCID: PMC4760885
- DOI: 10.1039/c5nr08706f
Ultratrace level determination and quantitative analysis of kidney injury biomarkers in patient samples attained by zinc oxide nanorods
Abstract
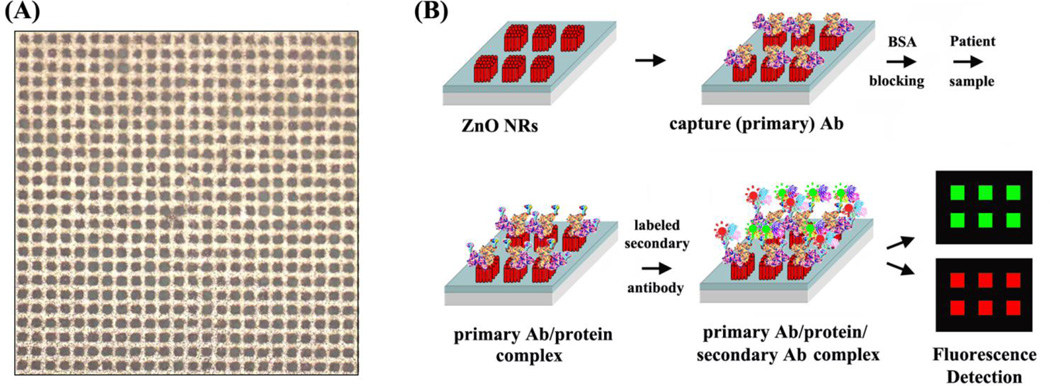
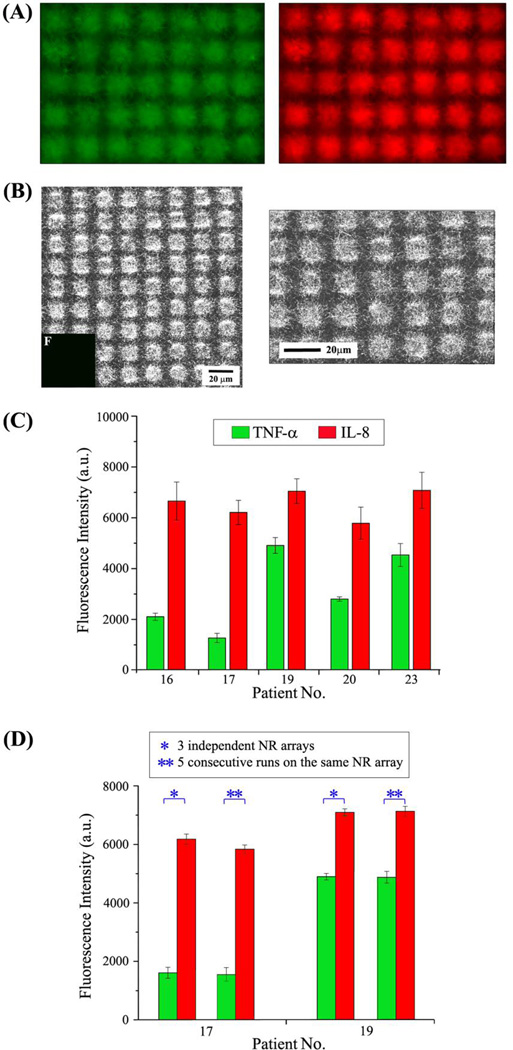
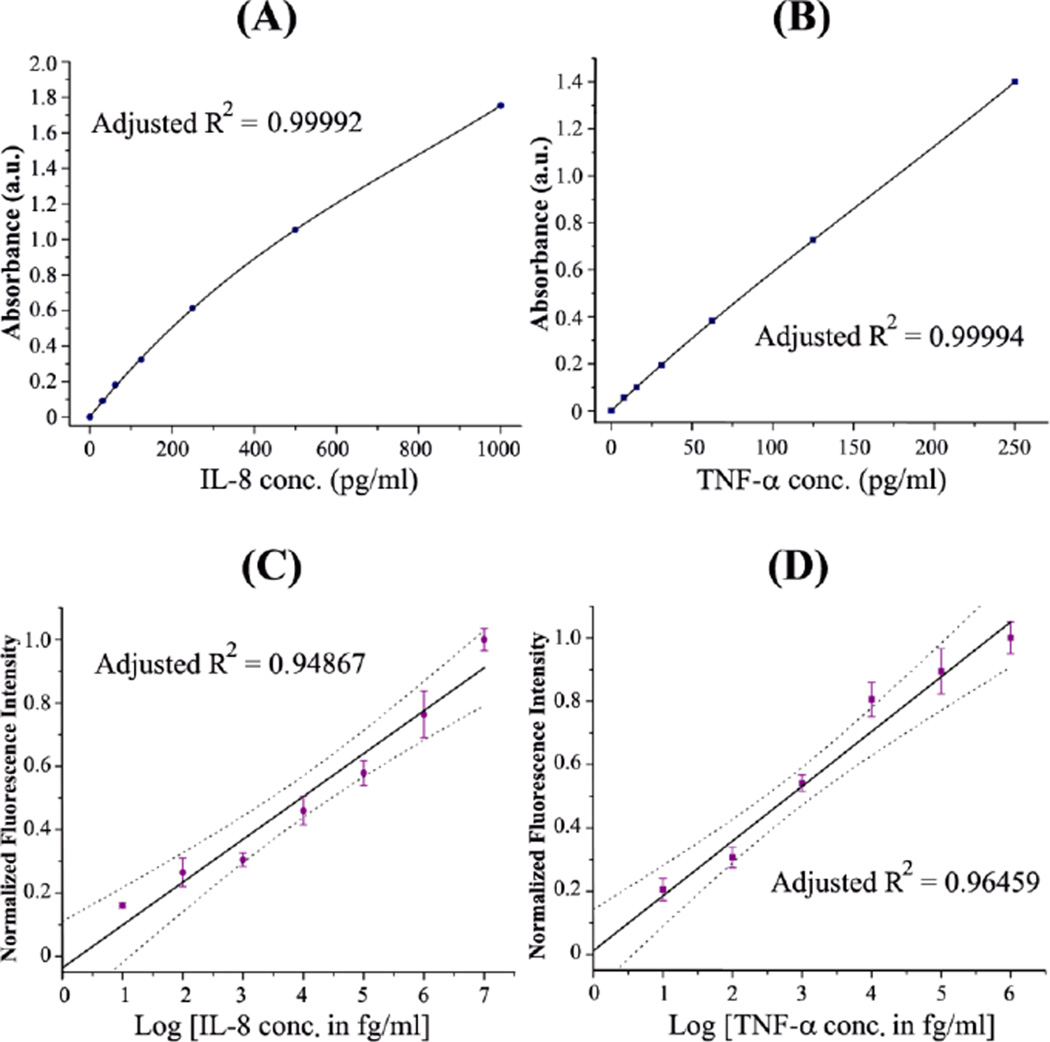
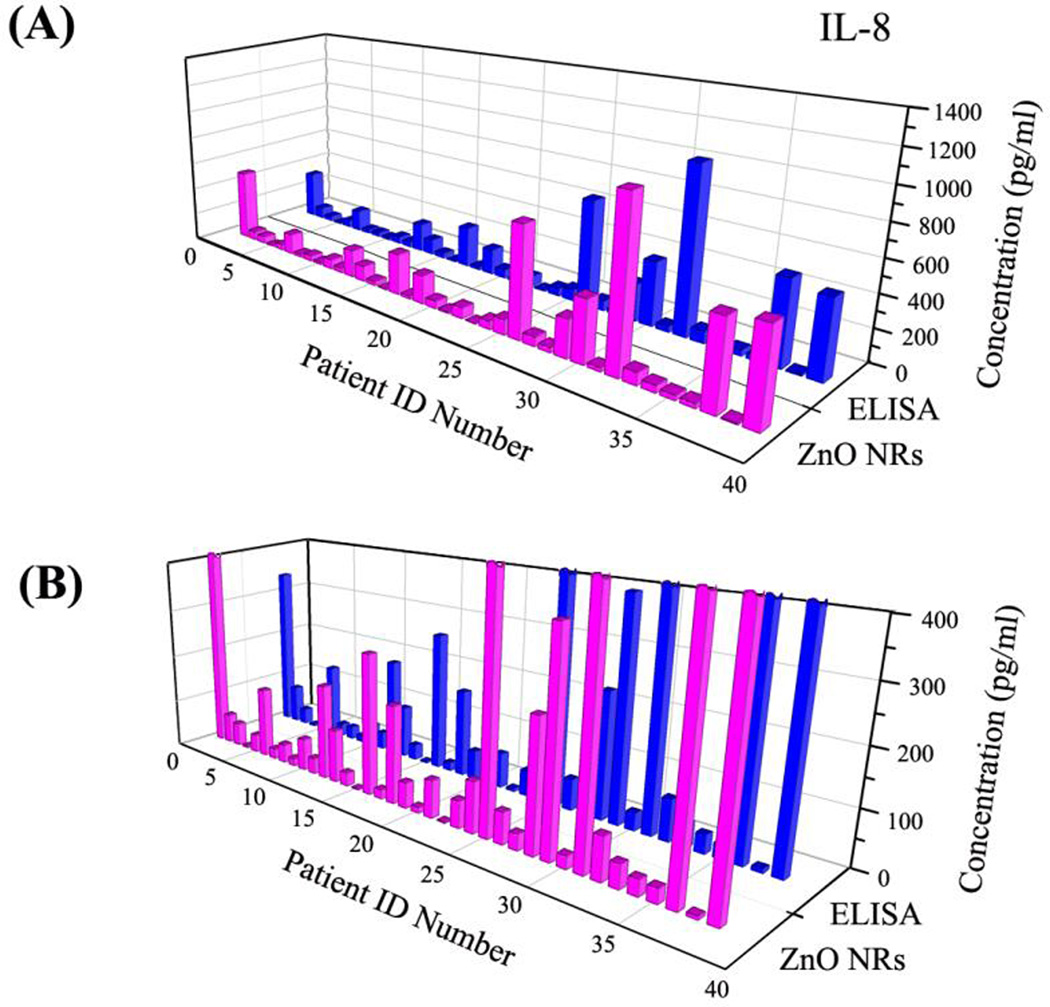
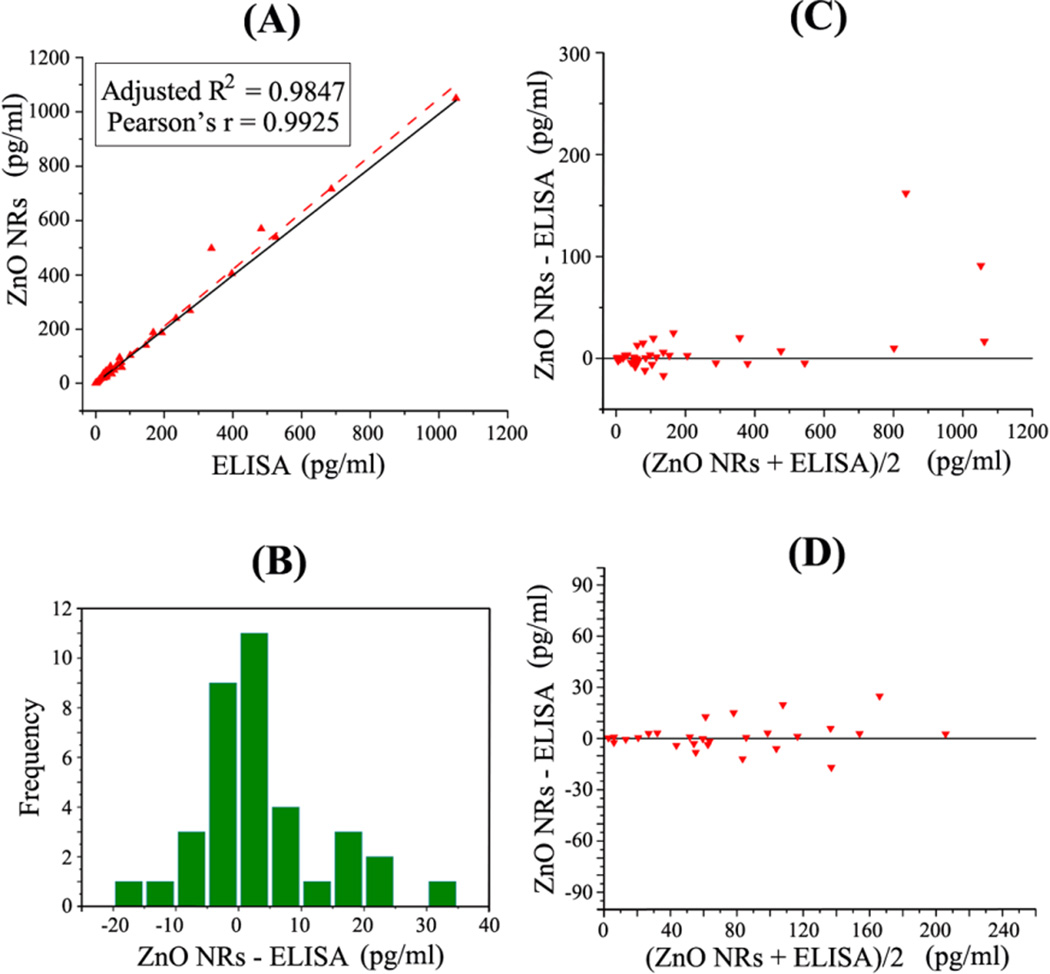
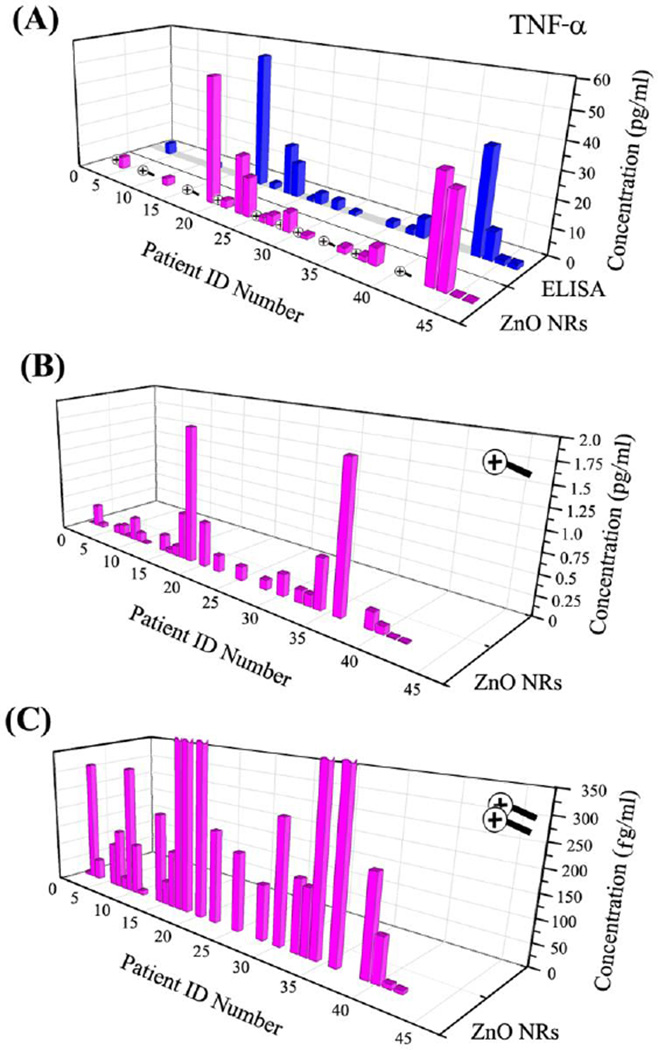
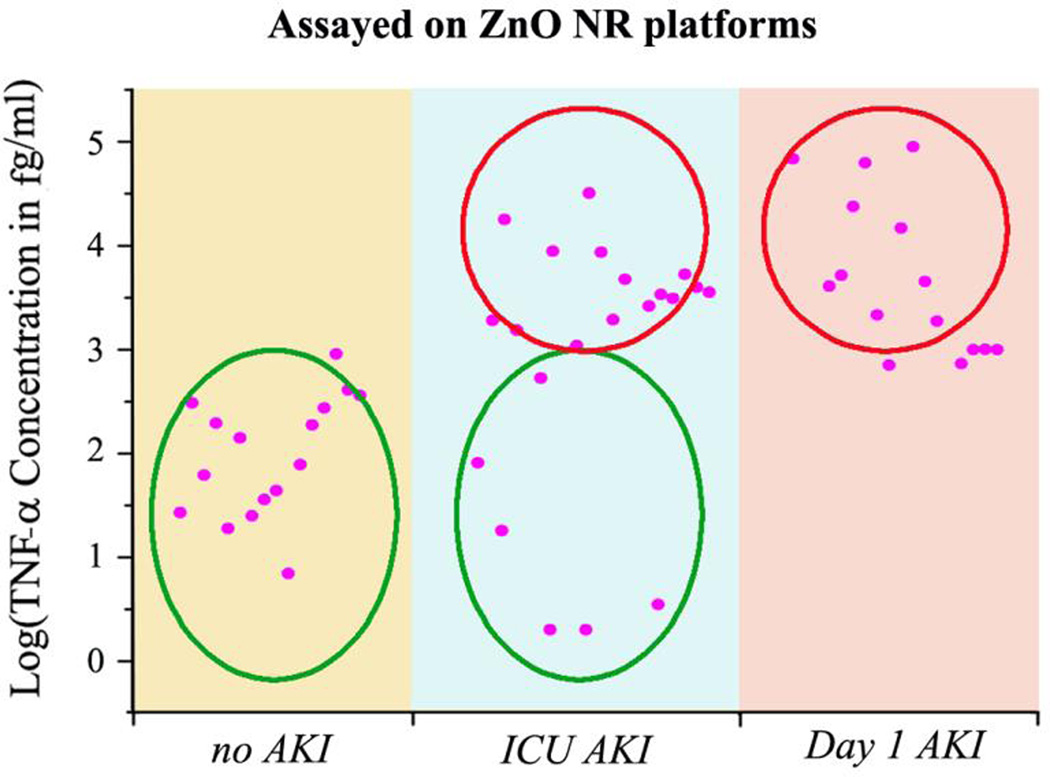
Determining ultratrace amounts of protein biomarkers in patient samples in a straightforward and quantitative manner is extremely important for early disease diagnosis and treatment. Here, we successfully demonstrate the novel use of zinc oxide nanorods (ZnO NRs) in the ultrasensitive and quantitative detection of two acute kidney injury (AKI)-related protein biomarkers, tumor necrosis factor (TNF)-α and interleukin (IL)-8, directly from patient samples. We first validate the ZnO NRs-based IL-8 results via comparison with those obtained from using a conventional enzyme-linked immunosorbent method in samples from 38 individuals. We further assess the full detection capability of the ZnO NRs-based technique by quantifying TNF-α, whose levels in human urine are often below the detection limits of conventional methods. Using the ZnO NR platforms, we determine the TNF-α concentrations of all 46 patient samples tested, down to the fg per mL level. Subsequently, we screen for TNF-α levels in approximately 50 additional samples collected from different patient groups in order to demonstrate a potential use of the ZnO NRs-based assay in assessing cytokine levels useful for further clinical monitoring. Our research efforts demonstrate that ZnO NRs can be straightforwardly employed in the rapid, ultrasensitive, quantitative, and simultaneous detection of multiple AKI-related biomarkers directly in patient urine samples, providing an unparalleled detection capability beyond those of conventional analysis methods. Additional key advantages of the ZnO NRs-based approach include a fast detection speed, low-volume assay condition, multiplexing ability, and easy automation/integration capability to existing fluorescence instrumentation. Therefore, we anticipate that our ZnO NRs-based detection method will be highly beneficial for overcoming the frequent challenges in early biomarker development and treatment assessment, pertaining to the facile and ultrasensitive quantification of hard-to-trace biomolecules.
Figures
Similar articles
-
Ultrasensitive detection of cytokines enabled by nanoscale ZnO arrays.Anal Chem. 2008 Sep 1;80(17):6594-601. doi: 10.1021/ac800747q. Epub 2008 Aug 6. Anal Chem. 2008. PMID: 18681455
-
Zinc oxide nanorod based immunosensing platform for the determination of human leukemic cells.Talanta. 2019 Aug 1;200:378-386. doi: 10.1016/j.talanta.2019.03.064. Epub 2019 Mar 16. Talanta. 2019. PMID: 31036199
-
Synthesizing, characterizing, and toxicity evaluating of Phycocyanin-ZnO nanorod composites: A back to nature approaches.Colloids Surf B Biointerfaces. 2019 Mar 1;175:221-230. doi: 10.1016/j.colsurfb.2018.12.002. Epub 2018 Dec 4. Colloids Surf B Biointerfaces. 2019. PMID: 30537618
-
Zinc oxide nanomaterials for biomedical fluorescence detection.J Nanosci Nanotechnol. 2014 Jan;14(1):475-86. doi: 10.1166/jnn.2014.9099. J Nanosci Nanotechnol. 2014. PMID: 24730276 Free PMC article. Review.
-
Fundamental Properties of One-Dimensional Zinc Oxide Nanomaterials and Implementations in Various Detection Modes of Enhanced Biosensing.Annu Rev Phys Chem. 2016 May 27;67:691-717. doi: 10.1146/annurev-physchem-031215-010949. Annu Rev Phys Chem. 2016. PMID: 27215822 Free PMC article. Review.
Cited by
-
Advances in Nanotechnology-Based Biosensing of Immunoregulatory Cytokines.Biosensors (Basel). 2021 Sep 30;11(10):364. doi: 10.3390/bios11100364. Biosensors (Basel). 2021. PMID: 34677320 Free PMC article. Review.
-
Emerging Cytokine Biosensors with Optical Detection Modalities and Nanomaterial-Enabled Signal Enhancement.Sensors (Basel). 2017 Feb 22;17(2):428. doi: 10.3390/s17020428. Sensors (Basel). 2017. PMID: 28241443 Free PMC article. Review.
-
Strain-Modulated and Nanorod-Waveguided Fluorescence in Single Zinc Oxide Nanorod-Based Immunodetection.Biosensors (Basel). 2024 Feb 3;14(2):85. doi: 10.3390/bios14020085. Biosensors (Basel). 2024. PMID: 38392004 Free PMC article.
-
Individual ZnO-Ag Hybrid Nanorods for Synergistic Fluorescence Enhancement Towards Highly Sensitive and Miniaturized Biodetection.Nanomaterials (Basel). 2025 Apr 17;15(8):617. doi: 10.3390/nano15080617. Nanomaterials (Basel). 2025. PMID: 40278482 Free PMC article.
-
Enhanced Optical Biosensing by Aerotaxy Ga(As)P Nanowire Platforms Suitable for Scalable Production.ACS Appl Nano Mater. 2022 Jul 22;5(7):9063-9071. doi: 10.1021/acsanm.2c01372. Epub 2022 Jul 1. ACS Appl Nano Mater. 2022. PMID: 35909504 Free PMC article.
References
-
- Preedy VR, Hunter RJ. Cytokines. Boca Raton, FL: CRC Press; 2011.
-
- Fichorova RN, Richardson-Harman N, Alfano M, Belec L, Carbonneil C, Chen S, Cosentino L, Curtis K, Dezzutti CS, Donoval B, Doncel GF, Donaghay M, Grivel J-C, Guzman E, Hayes M, Herold B, Hillier S, Lackman-Smith C, Landay A, Margolis L, Mayer KH, Pasicznyk J-M, Pallansch-Cokonis M, Poli G, Reichelderfer P, Roberts P, Rodriguez I, Saidi H, Sassi RR, Shattock R, Cummins JJE. Anal. Chem. 2008;80:4741–4751. - PMC - PubMed
-
- Borish LC, Steinke JW. J. Allergy Clin. Immunol. 2003;111:S460–S475. - PubMed
Publication types
MeSH terms
Substances
Grants and funding
LinkOut - more resources
Full Text Sources
Other Literature Sources