. 2016 Feb 4:17:20.
doi: 10.1186/s13059-016-0882-7.

Characterization of chromatin accessibility with a transposome hypersensitive sites sequencing (THS-seq) assay

Affiliations

Characterization of chromatin accessibility with a transposome hypersensitive sites sequencing (THS-seq) assay

Brandon Chin Sos et al. Genome Biol. .

Abstract

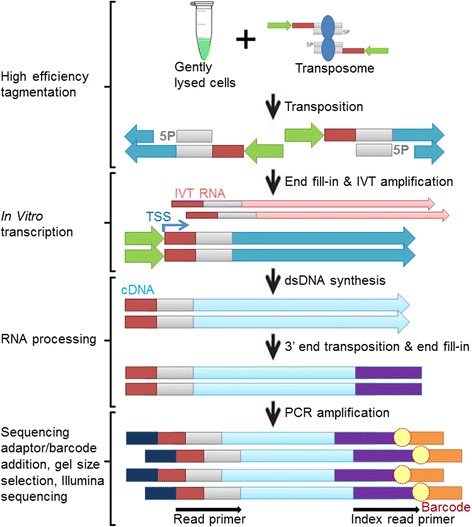
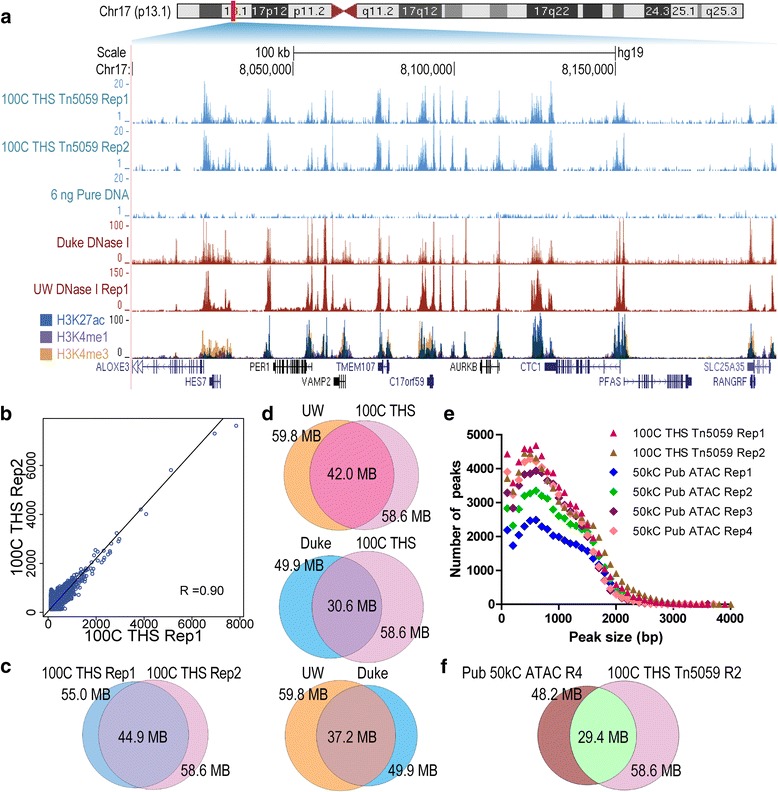
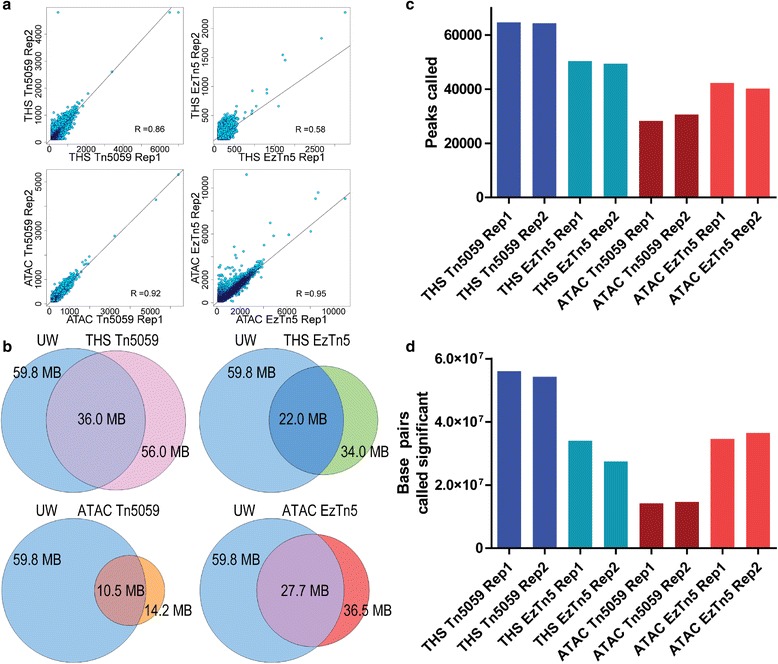
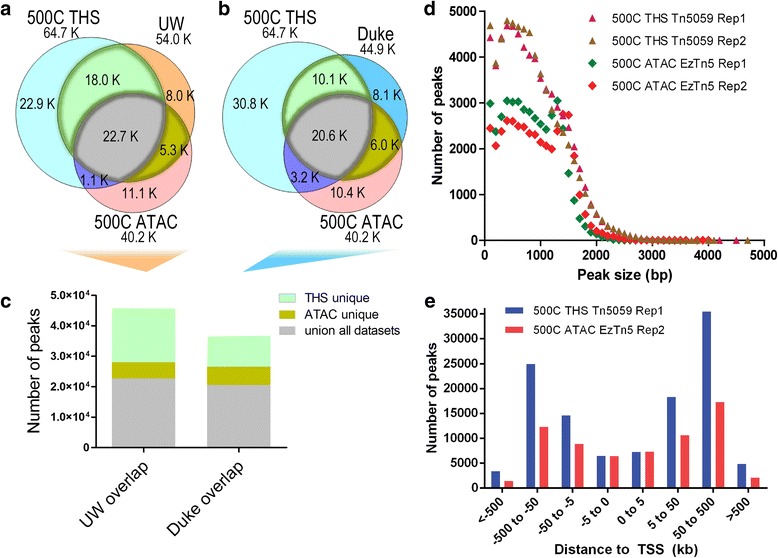
Chromatin accessibility captures in vivo protein-chromosome binding status, and is considered an informative proxy for protein-DNA interactions. DNase I and Tn5 transposase assays require thousands to millions of fresh cells for comprehensive chromatin mapping. Applying Tn5 tagmentation to hundreds of cells results in sparse chromatin maps. We present a transposome hypersensitive sites sequencing assay for highly sensitive characterization of chromatin accessibility. Linear amplification of accessible DNA ends with in vitro transcription, coupled with an engineered Tn5 super-mutant, demonstrates improved sensitivity on limited input materials, and accessibility of small regions near distal enhancers, compared with ATAC-seq.


Figures

Fig. 1
Fig. 1
Schematic overview of THS-seq. High efficiency tagmentation is performed on gently lysed cells, followed by in vitro transcription, and custom RNA-seq to generate barcoded sequencing libraries. The following colors depict the following segments: light gray segments are Tn5 mosaic ends sequences, green segments are T7 promoter sequences, dark red segments are read primer sequences, dark blue segments are genomic DNA, light blue segments are cDNA sequences, purple segments are 3’ adaptor sequences, orange and navy blue segments are Illumina adaptor sequences, and yellow circles are barcodes
Fig. 2
Fig. 2
Validation of 100-cell THS-seq/Tn5059 data against ENCODE data and ATAC-seq data. a 200 kb view of accessible chromatin marks in GM12878 lymphoblastoid cells in 100-cell THS-seq/Tn5059 data, a purified DNA control, published ENCODE accessibility data from Duke and UW, and ENCODE histone modifications which are often found near regulatory elements and promoters. b Correlation of 100-cell THS-seq/Tn5059 replicate 1 data and 100-cell THS-seq/Tn5059 replicate 2 data. c Base pair overlap of 100-cell THS-seq/Tn5059 replicate 1 data and 100-cell THS-seq/Tn5059 replicate 2 data. d Base pair overlap between 100-cell THS-seq/Tn5059 replicate 2 data and ENCODE datasets, and ENCODE datasets base pair overlap among themselves. 100-cell THS-seq/Tn5059 replicate 2 data were used in ENCODE comparisons because they had the most base pairs in peaks called significant. e Peak size distributions between 100-cell THS-seq/Tn5059 datasets, and published 50,000-cell ATAC-seq datasets. f Base pair overlap between 100-cell THS-seq/Tn5059 and published 50,000-cell ATAC-seq replicate 4 data. Published 50,000-cell ATAC-seq replicate 4 data were used since they had the most base pairs called significant compared to the other published 50,000-cell ATAC-seq datasets
Fig. 3
Fig. 3
Comparison between THS-seq/Tn5059, THS-seq/EzTn5, ATAC-seq/Tn5059, and ATAC-seq/EzTn5 with 500 cells of input material. All datasets and replicates were down-sampled to 8,351,125 unique alignments before analysis. a Correlation between replicates for each experimental condition. b Base pair overlap of each experimental condition with UW data. The replicate with the most base pairs called significant was used in analysis and represented in each condition. UW data were chosen since they had the most base pairs called significant of the ENCODE datasets. c Total number of peaks called by Dfilter for each condition. d Total number of base pairs under peaks called significant by Dfilter
Fig. 4
Fig. 4
Comparison between the two most comprehensive datasets of 500-cell THS-seq/Tn5059 and 500-cell ATAC-seq/EzTn5. a Venn diagram depicting peak overlap between 500-cell THS-seq/Tn5059, 500-cell ATAC-seq/EzTn5, and ENCODE UW data. A peak is shared if 1 base pair or more overlaps with a peak in the dataset being compared to. b Venn diagram depicting peak overlap between 500-cell THS-seq/Tn5059, 500-cell ATAC-seq/EzTn5, and ENCODE Duke data. A peak is shared if 1 base pair or more overlaps with a peak in the dataset being compared to. c Representation of the number of peaks that are shared between all three datasets for UW data, peaks that are found by 500-cell THS-seq/Tn5059 data and ENCODE UW data and not 500-cell ATAC-seq/EzTn5 data, and peaks that are found by 500-cell ATAC-seq/EzTn5 data and ENCODE UW data and not 500-cell THS-seq/Tn5059 data. Also a representation of the number of peaks that are shared between all three datasets for Duke data, peak regions that are found by 500-cell THS-seq/Tn5059 data and ENCODE Duke data and not 500-cell ATAC-seq/EzTn5 data, and peaks that are found by 500-cell ATAC-seq/EzTn5 data and ENCODE Duke data and not 500-cell THS-seq/Tn5059 data. d Comparison of peak size distributions. e Peak distances from transcription start sites as determined by GREAT [28]
Fig. 5
Fig. 5
Validation of peaks based on peak length. a Base pair overlap with ENCODE UW data based on peak lengths for 100-cell and 500-cell THS-seq/Tn5059 data, and 500-cell ATAC-seq/EzTn5 data. b Base pair overlap with ENCODE Duke data based on peak lengths for 100-cell and 500-cell THS-seq/Tn5059 data, and 500-cell ATAC-seq/EzTn5 data. c The percentage more peaks found in 100-cell and 500-cell THS-seq/Tn5059 than in 500-cell ATAC-seq/EzTn5 data, and the percentage more normalized 100-cell and 500-cell THS-seq/Tn5059 and UW base pair overlap than in 500-cell ATAC-seq/EzTn5. Normalizing was performed using the global base pair overlap values for each ENCODE dataset. d Zoom in on graph (c) showing the peak lengths between 100-1,200 base pairs
Fig. 6
Fig. 6
THS-seq and ATAC-seq peak capture preferences and biases. All datasets and replicates were down-sampled to 8,351,125 unique alignments before analysis. a Total percentage of unique alignments in peaks out of the 8,351,125 unique alignments for each dataset. b The percentage of alignments that are in the larger 30 % of peaks called significant for each individual sample and replicate. c The percentage of alignments that are in the smaller 70 % of peaks called significant for each individual sample and replicate. d-f For all peaks in each individual dataset, the normalized number of alignments in each peak length, with peak lengths in increments of 100 base pairs, represented by mean ± SEM in (d) 100-cell THS-seq/Tn5059 data and 500-cell ATAC-seq/EzTn5 data, (e) 500-cell THS-seq/EzTn5 data and 500-cell ATAC-seq/Tn5059 data, and (f) 100-cell THS-seq/Tn5059 data and published 50,000-cell ATAC-seq data. Some data points were excluded from the graphs because values were beyond the axis, and the number of data points excluded for each graph is: (d) 13, (e) 16, and (f) 8

References

    1. Sabo PJ, Humbert R, Hawrylycz M, Wallace JC, Dorschner MO, McArthur M, et al. Genome-wide identification of DNasel hypersensitive sites using active chromatin sequence libraries. Proc Natl Acad Sci U S A. 2004;101(13):4537–42. doi: 10.1073/pnas.0400678101. - DOI - PMC - PubMed
    1. Sabo PJ, Kuehn MS, Thurman R, Johnson BE, Johnson EM, Cao H, et al. Genome-scale mapping of DNase I sensitivity in vivo using tiling DNA microarrays. Nat Methods. 2006;3(7):511–8. doi: 10.1038/nmeth890. - DOI - PubMed
    1. Song L, Crawford GE. DNase-seq: a high-resolution technique for mapping active gene regulatory elements across the genome from mammalian cells. Cold Spring Harb Protoc. 2010;2010(2):pdb prot5384. doi: 10.1101/pdb.prot5384. - DOI - PMC - PubMed
    1. Giresi PG, Kim J, McDaniell RM, Iyer VR, Lieb JD. FAIRE (Formaldehyde-Assisted Isolation of Regulatory Elements) isolates active regulatory elements from human chromatin. Genome Res. 2007;17(6):877–85. doi: 10.1101/gr.5533506. - DOI - PMC - PubMed
    1. Buenrostro JD, Giresi PG, Zaba LC, Chang HY, Greenleaf WJ. Transposition of native chromatin for fast and sensitive epigenomic profiling of open chromatin, DNA-binding proteins and nucleosome position. Nat Methods. 2013;10(12):1213–8. doi: 10.1038/nmeth.2688. - DOI - PMC - PubMed

Publication types