

Characterization of the aodA, dnmA, mnSOD and pimA genes in Aspergillus nidulans
- PMID: 26846452
- PMCID: PMC4742808
- DOI: 10.1038/srep20523
Characterization of the aodA, dnmA, mnSOD and pimA genes in Aspergillus nidulans
Abstract
Mitochondria play key roles in cellular energy generation and lifespan of most eukaryotes. To understand the functions of four nuclear-encoded genes predicted to be related to the maintenance of mitochondrial morphology and function in Aspergillus nidulans, systematic characterization was carried out. The deletion and overexpression mutants of aodA, dnmA, mnSOD and pimA encoding alternative oxidase, dynamin related protein, manganese superoxide dismutase and Lon protease, respectively, were generated and examined for their growth, stress tolerances, respiration, autolysis, cell death, sterigmatocystin production, hyphal morphology and size, and mitochondrial superoxide production as well as development. Overall, genetic manipulation of these genes had less effect on cellular physiology and ageing in A. nidulans than that of their homologs in another fungus Podospora anserina with a well-characterized senescence. The observed interspecial phenotypic differences can be explained by the dissimilar intrinsic stabilities of the mitochondrial genomes in A. nidulans and P. anserina. Furthermore, the marginally altered phenotypes observed in A. nidulans mutants indicate the presence of effective compensatory mechanisms for the complex networks of mitochondrial defense and quality control. Importantly, these findings can be useful for developing novel platforms for heterologous protein production, or on new biocontrol and bioremediation technologies based on Aspergillus species.
Figures
 ) alternative oxidase (AOX;
  ) and KCN + SHAM-resistant respirations (
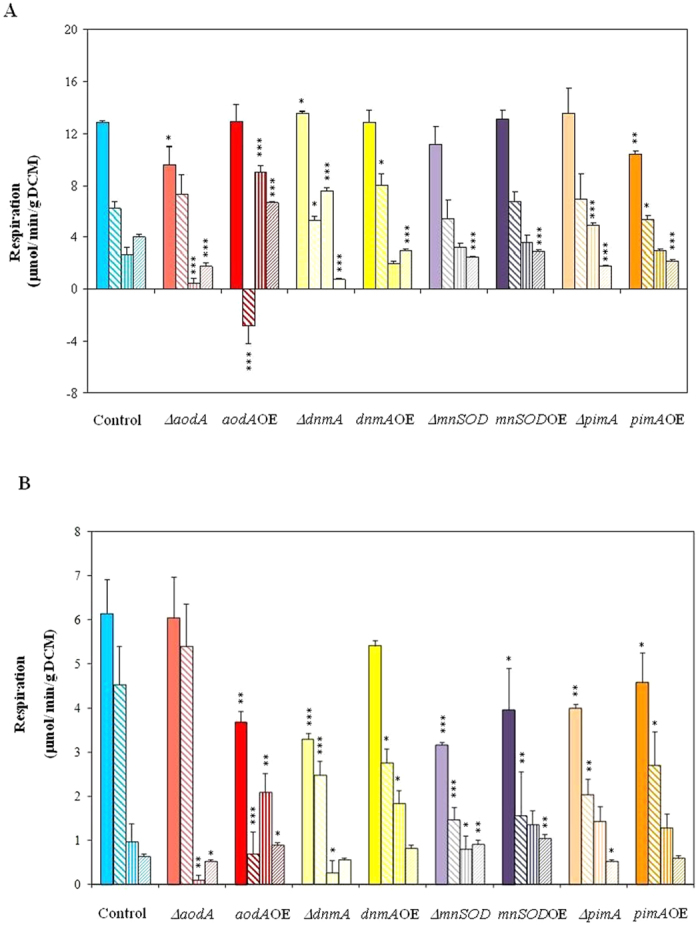
 ) ( μmol/min/g DCM) recorded either in young cultures supplemented with 2% glucose (Part A) or in old, carbon starving cultures (Part B). KCN-sensitive and AOX-dependent respiration were calculated by substraction of KCN-resistant from total respiration and of KCN-SHAM from KCN respiration, respectively. In Part A, the addition of KCN even stimulated the respiration of the aodAOE strain and, hence, we got a virtual negative value for the KCN-sensitive respiration in this case. This paradoxical behavior can be explained with the considerably increased capacity of the AOX-dependent respiratory pathway similar to that observed before in the P. anserina AOX overexpression strain by Lorin et al.. Mean ± SD values calculated from three independent experiments are presented. Statistically significant differences compared to the control determined by the Student’s t test are marked with asterisks: *p < 5%, **p < 1%, ***p < 0.1%. In all respiration rate assays, the THS30.3 strain was used as the control strain.
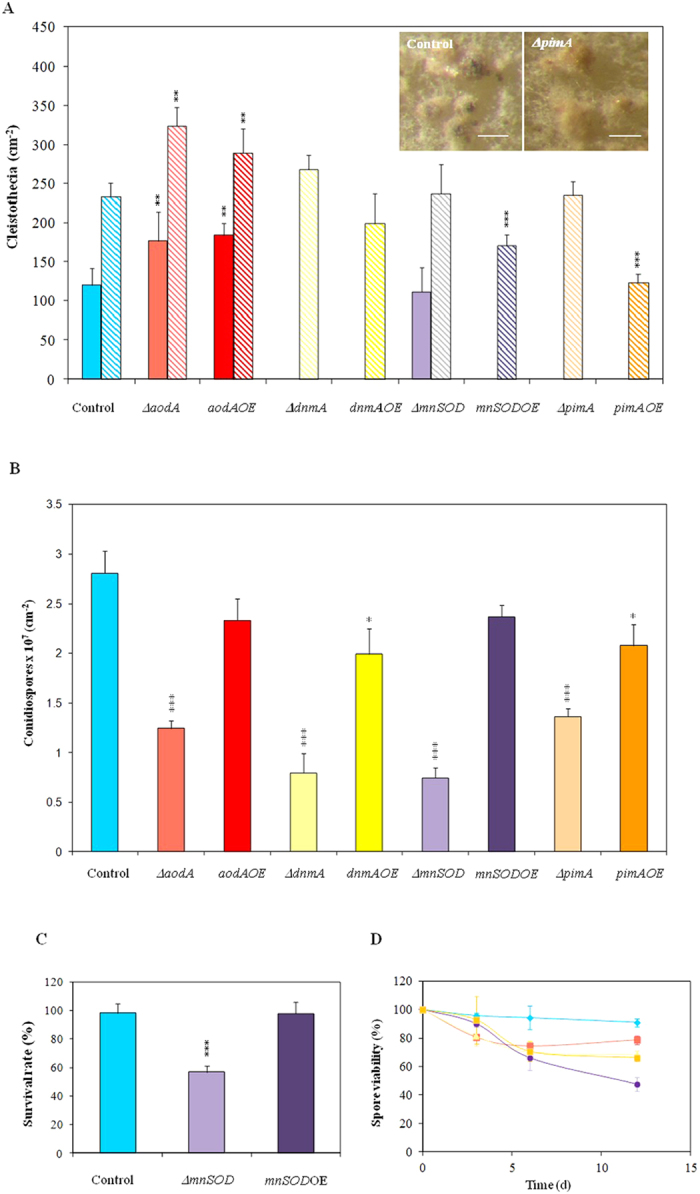
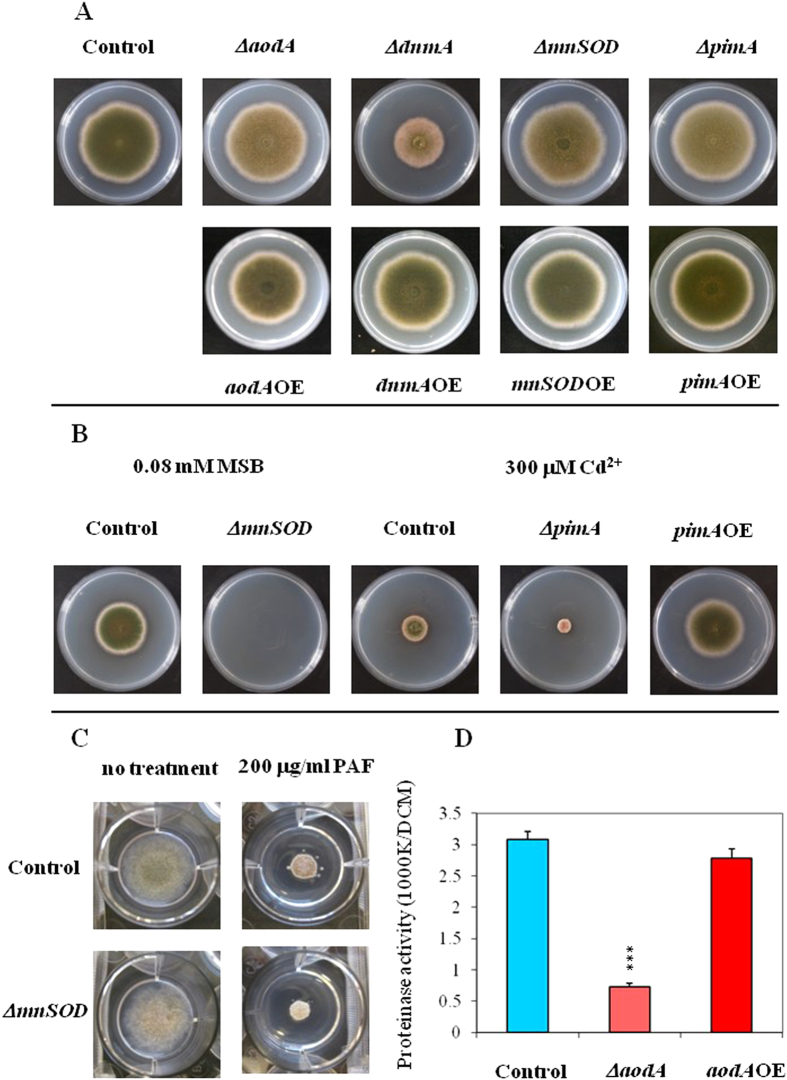
 ) incubations. Both the deletion and overexpression of aodA stimulated meanwhile the overexpression of mnSOD and of pimA hindered the formation of fruiting bodies. Photographs show 8 d cleistothecia of the control (THS30.3) and ΔpimA strains. Note that cleistothecia of the ΔpimA strain were sterile. (Scale bars: 200 μm). Part B: Conidiospore productions. All gene deletion strains and the pimAOE overexpression strain produced less conidiospores than the control strain. Part C: Heat stress sensitivity of the ΔmnSOD conidia. Conidia without heat treatment (50 °C for 10 min) were used as control. As shown in Supplementary Fig. S5, only conidia of the ΔmnSOD strain were sensitive to heat stress. Part D: Decreasing asexual spore viabilities during storage at 4 °C. Symbols represent the following strains:
  , THS30.3 (control strain),
  , ∆aodA,
  , ∆dnmA,
 , ∆mnSOD and,
  , ∆pimA. The spore viabilities of all gene deletion strains were significantly lower (p < 5% at 6 and 12 d incubation times) than that of the THS30.3 control strain. Note that no significant decreases in the conidiospore viabilities were recorded in the gene overexpression strains and, hence, these data are not shown here for clarity. In Parts A-C, mean ± SD values calculated from three independent experiments are presented. Significant differences determined by the Student’s t test are marked with asterisks: **p < 1%, ***p < 0.1%. In Part D, per cent decreases in the spore viabilities (mean ± SD values calculated from three independent experiments) are presented.
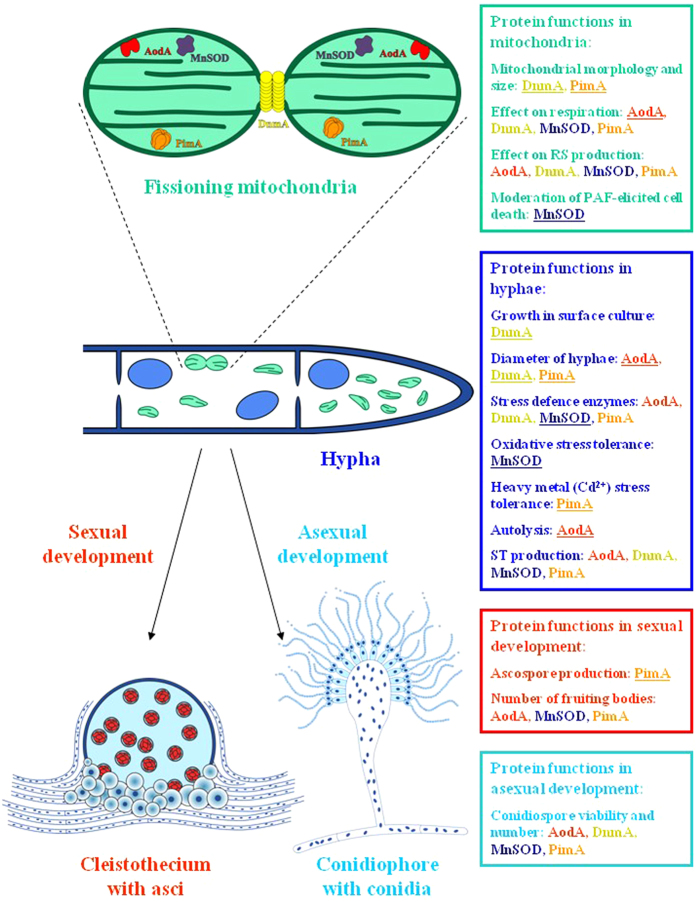
Similar articles
-
Analysis of the Relationship between Alternative Respiration and Sterigmatocystin Formation in Aspergillus nidulans.Toxins (Basel). 2018 Apr 20;10(4):168. doi: 10.3390/toxins10040168. Toxins (Basel). 2018. PMID: 29677138 Free PMC article.
-
Copper-modulated gene expression and senescence in the filamentous fungus Podospora anserina.Mol Cell Biol. 2001 Jan;21(2):390-9. doi: 10.1128/MCB.21.2.390-399.2001. Mol Cell Biol. 2001. PMID: 11134328 Free PMC article.
-
Proteomic analysis of mitochondria from senescent Podospora anserina casts new light on ROS dependent aging mechanisms.Exp Gerontol. 2014 Aug;56:13-25. doi: 10.1016/j.exger.2014.02.008. Epub 2014 Feb 18. Exp Gerontol. 2014. PMID: 24556281
-
Mitochondrial metabolism and aging in the filamentous fungus Podospora anserina.Biochim Biophys Acta. 2006 May-Jun;1757(5-6):604-10. doi: 10.1016/j.bbabio.2006.03.005. Epub 2006 Mar 30. Biochim Biophys Acta. 2006. PMID: 16624249 Review.
-
Mitochondrial Lon Protease and Cancer.Adv Exp Med Biol. 2017;1038:173-182. doi: 10.1007/978-981-10-6674-0_12. Adv Exp Med Biol. 2017. PMID: 29178076 Review.
Cited by
-
Superoxide Dismutases in Eukaryotic Microorganisms: Four Case Studies.Antioxidants (Basel). 2022 Jan 19;11(2):188. doi: 10.3390/antiox11020188. Antioxidants (Basel). 2022. PMID: 35204070 Free PMC article. Review.
-
Transcriptomic responses of Aspergillus flavus to temperature and oxidative stresses during aflatoxin production.Sci Rep. 2021 Feb 2;11(1):2803. doi: 10.1038/s41598-021-82488-7. Sci Rep. 2021. PMID: 33531617 Free PMC article.
-
Targeting the alternative oxidase (AOX) for human health and food security, a pharmaceutical and agrochemical target or a rescue mechanism?Biochem J. 2022 Jun 30;479(12):1337-1359. doi: 10.1042/BCJ20180192. Biochem J. 2022. PMID: 35748702 Free PMC article. Review.
-
The DUG Pathway Governs Degradation of Intracellular Glutathione in Aspergillus nidulans.Appl Environ Microbiol. 2021 Apr 13;87(9):e01321-20. doi: 10.1128/AEM.01321-20. Print 2021 Apr 13. Appl Environ Microbiol. 2021. PMID: 33637571 Free PMC article.
-
The Negative Effect of Protein Phosphatase Z1 Deletion on the Oxidative Stress Tolerance of Candida albicans Is Synergistic with Betamethasone Exposure.J Fungi (Basel). 2021 Jul 6;7(7):540. doi: 10.3390/jof7070540. J Fungi (Basel). 2021. PMID: 34356919 Free PMC article.
References
-
- Osiewacz H. D. & Scheckhuber C. Q. Impact of ROS on ageing of two fungal model systems: Saccharomyces cerevisiae and Podospora anserina. Free Rad Res 40, 1350–1358 (2006). - PubMed
-
- Ugidos A., Nyström T. & Caballero A. Perspectives on the mitochondrial etiology of replicative aging in yeast. Exp Gerontol 45, 512–515 (2010). - PubMed
-
- Osiewacz H. D. Mitochondrial quality control in aging and lifespan control of the fungal aging model Podospora anserina. Biochem Soc Trans 39, 1488–1492 (2011). - PubMed
-
- Osiewacz H. D. & Bernhardt D. Mitochondrial quality control: impact on aging and life span-a mini-review. Gerontology 59, 413–420 (2013). - PubMed
Publication types
MeSH terms
Substances
LinkOut - more resources
Full Text Sources
Other Literature Sources
Molecular Biology Databases
