. 2016 Feb 5:6:20189.
doi: 10.1038/srep20189.

BKM-120 (Buparlisib): A Phosphatidyl-Inositol-3 Kinase Inhibitor with Anti-Invasive Properties in Glioblastoma

Affiliations

BKM-120 (Buparlisib): A Phosphatidyl-Inositol-3 Kinase Inhibitor with Anti-Invasive Properties in Glioblastoma

Maria-Carmela Speranza et al. Sci Rep. .

Abstract

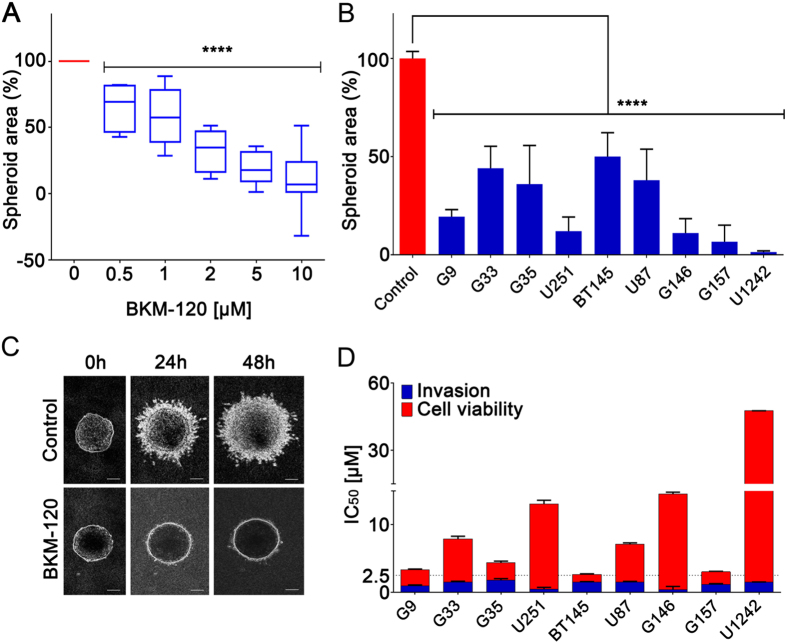
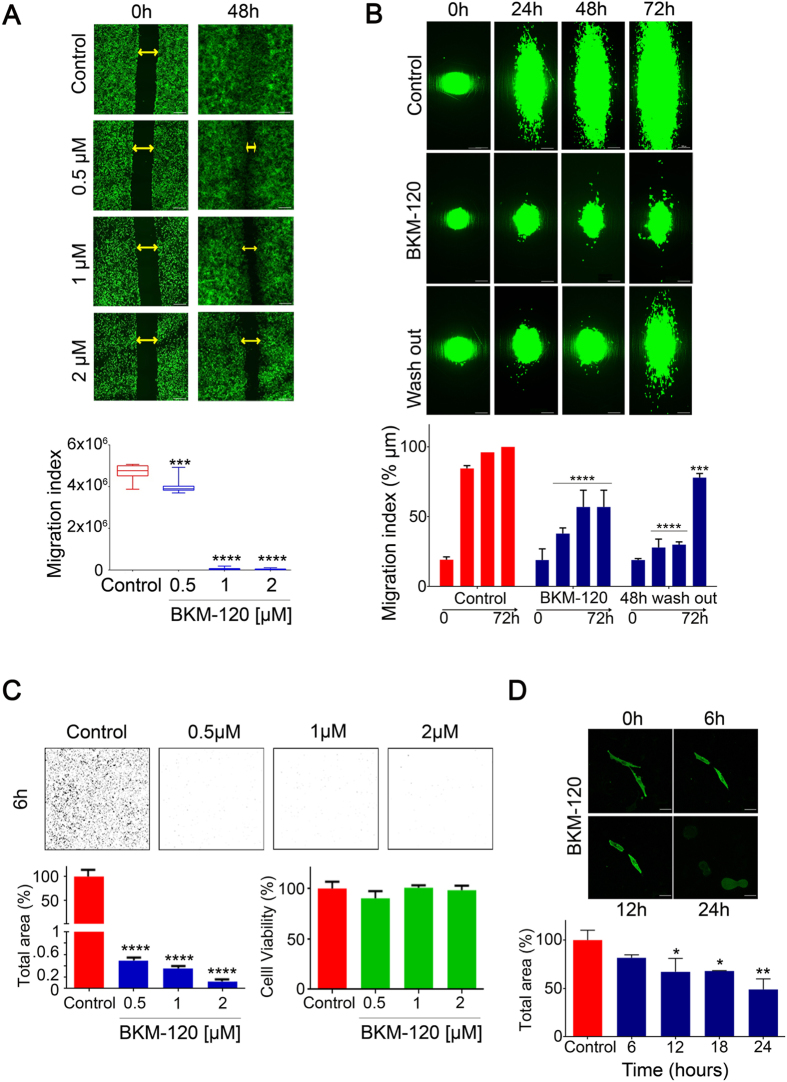
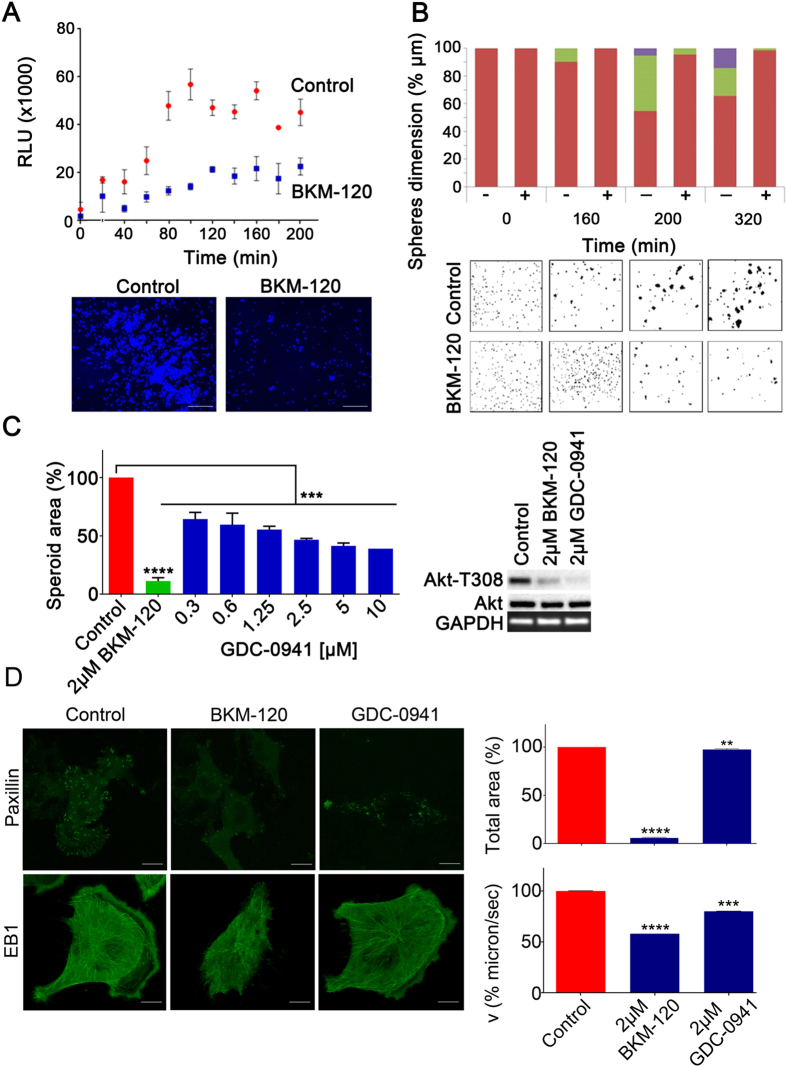
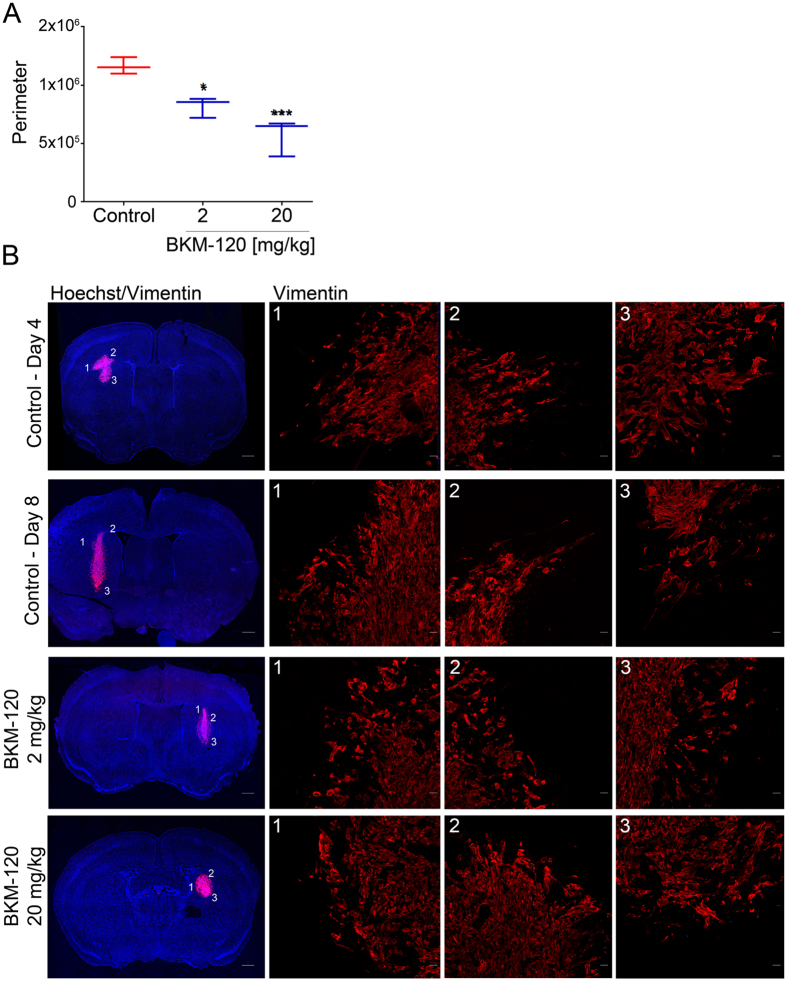
Glioblastoma is an aggressive, invasive tumor of the central nervous system (CNS). There is a widely acknowledged need for anti-invasive therapeutics to limit glioblastoma invasion. BKM-120 is a CNS-penetrant pan-class I phosphatidyl-inositol-3 kinase (PI3K) inhibitor in clinical trials for solid tumors, including glioblastoma. We observed that BKM-120 has potent anti-invasive effects in glioblastoma cell lines and patient-derived glioma cells in vitro. These anti-migratory effects were clearly distinguishable from cytostatic and cytotoxic effects at higher drug concentrations and longer durations of drug exposure. The effects were reversible and accompanied by changes in cell morphology and pronounced reduction in both cell/cell and cell/substrate adhesion. In vivo studies showed that a short period of treatment with BKM-120 slowed tumor spread in an intracranial xenografts. GDC-0941, a similar potent and selective PI3K inhibitor, only caused a moderate reduction in glioblastoma cell migration. The effects of BKM-120 and GDC-0941 were indistinguishable by in vitro kinase selectivity screening and phospho-protein arrays. BKM-120 reduced the numbers of focal adhesions and the velocity of microtubule treadmilling compared with GDC-0941, suggesting that mechanisms in addition to PI3K inhibition contribute to the anti-invasive effects of BKM-120. Our data suggest the CNS-penetrant PI3K inhibitor BKM-120 may have anti-invasive properties in glioblastoma.


Figures

Figure 1
Figure 1. BKM-120 inhibits invasion in a dose-dependent manner in GBM cell lines.
(A) The graph represents an average of the effects of BKM-120 on nine different GBM cell lines and GSCs. (B) Effect of increasing concentrations of BKM-120 in spheroid invasion assays in a panel of GBM cell lines. Invasion was measured after 48 hours of BKM-120 treatment and is expressed as sphere area as a percentage of controls. (C) Image of G9 spheroids after treatment with 2 μM BKM-120 (bar = 100 μm) (lower panel) compared with controls (upper panel). (D) Invasion (blue) and cell viability (red) IC50 values for BKM-120. IC50 was calculated using data from a range of BKM-120 concentrations. Measurements were obtained at 48h of treatment. One-way ANOVA was used for statistical analysis (****p < 0.0001).
Figure 2
Figure 2. Impact of BKM-120 on GBM cell migration and morphology.
(A) Time-lapse images of U251-GFP GBM cells in wound-healing assays performed on U251-copGFP with increasing concentrations of BKM-120 (0.5, 1 and 2 μM) over 48 h. Controls were treated with DMSO. The gap is indicated by double arrows and the migration index was measured as total area of the gap (bar = 100 μm). (B) Time course over 72 hours on nanofiber scaffolds of G9-copGFP GBM cells treated with DMSO or BKM-120 (2 μM). The wash out performed at 48 hours demonstrates recovery of cell migration after drug removal. The lower graph indicates percentage of migration index compared to controls at 72 hours (100%) (bar = 100 μm). (C) Dose-dependent effect of BKM-120 on U251 GBM cells in transwell assays after 6 hours. The images show the ImageJ generated masks used to quantify the cell migration. Cell viability assays were performed on the same cells at the same time point using PrestoBlue. (D) Cell morphology. Time course of U251-copGFP GBM cell shape changes after treatment with 2 μM BKM-120 (bar = 50 μm). The graph indicates the percentage of total area compared to time 0h at 6, 12 and 24 hours (100%) (bar = 100 μm). One-way ANOVA was used for statistical analysis (*p < 0.05, **p < 0.01, ***p < 0.001, ****p < 0.0001).
Figure 3
Figure 3. BKM-120 reduces GBM cell adhesion, focal adhesions and microtubule dynamics.
(A) Cell-substrate adhesion was evaluated using G9-copGFP GSCs as described in Materials and Methods. Measurements were taken as luminescence output, RLU (relative light units), every 20 minutes over a time course of 200 minutes. The lower panel shows DAPI staining of G9-copGFP GSCs at the final time-point (200 min, bar = 500 μm). (B) Cell-cell adhesion in G9-copGFP GSCs. Sphere dimensions are indicated as a percentage relative to controls at the indicated time-points. The sphere dimension range is color coded in red for <3000 μm (1), green for 3000 - 6000 μm (2) and violet > 6000 μm (3). (C) Left panel: spheroid invasion assay on G9-copGFP GSCs with 2 μM of BKM-120 and a range of GDC-0941 concentrations. Invasion was measured after 48 hours and is expressed as percentage of spheroid area compared to controls. Right panel: Akt phosphorylation levels were measured by Western blot after 30 minutes treatment with 2 μM of BKM-120 or GDC-0941. (D) U251-paxillin-GFP images (bar = 20 μm) and U251-EB1-GFP time-lapse (bar = 10 μm) at 24h after DMSO, BKM-120 or GDC-0941 treatment. The total area of the paxillin-GFP signal and the velocity (microns/sec) of EB1 were measured using ImageJ. Each measurement was made in triplicate. One-way ANOVA was used for statistical analysis (**p < 0.01, ***p < 0.001, ****p < 0.0001).
Figure 4
Figure 4. BKM-120 treatment blocks glioma growth and invasion in vivo.
To analyze the effects of BKM-120 in vivo, we injected U1242 cells intracranially in nude mice and treated them daily with 2 mg/kg and 20 mg/kg of BKM-120 by gavage. (A) Average of the the tumors perimeters measured at day 7, and corrected for the averages of the size of the tumors at day 4. (B) Tumor spread was examined using Vimentin and DAPI staining. Photographs illustrate tumor growth (low resolution, bar = 1 mm) and the tumor normal brain interface indicating the degree of invasion (high resolution, bar = 20 μm). One-way ANOVA was used for statistical analysis (**p < 0.01, ***p < 0.001).

References

    1. Cloughesy T. F., Cavenee W. K. & Mischel P. S. Glioblastoma: From Molecular Pathology to Targeted Treatment. Annu Rev Pathol. 9, 1–25 (2013). - PubMed
    1. Ostrom Q. T. et al. CBTRUS Statistical Report: Primary Brain and Central Nervous System Tumors Diagnosed in the United States in 2007–2011. Neurooncol. 16, 1–63 (2014). - PMC - PubMed
    1. Stupp R. et al. Radiotherapy plus concomitant and adjuvant temozolomide for glioblastoma. N. Engl. J. Med. 352, 987–96 (2005). - PubMed
    1. McCarty J. H. Glioblastoma resistance to anti-VEGF therapy: Has the challenge been MET? Clin. Cancer Res. 9, 1631–33 (2013). - PMC - PubMed
    1. Dunn G. P. et al. Emerging insights into the molecular and cellular basis of glioblastoma. Genes Dev. 15, 756–84 (2012). - PMC - PubMed

Publication types

MeSH terms