. 2016 Apr 8;291(15):8121-9.
doi: 10.1074/jbc.M116.714014. Epub 2016 Feb 4.

PPARα (Peroxisome Proliferator-activated Receptor α) Activation Reduces Hepatic CEACAM1 Protein Expression to Regulate Fatty Acid Oxidation during Fasting-refeeding Transition

Affiliations

PPARα (Peroxisome Proliferator-activated Receptor α) Activation Reduces Hepatic CEACAM1 Protein Expression to Regulate Fatty Acid Oxidation during Fasting-refeeding Transition

Sadeesh K Ramakrishnan et al. J Biol Chem. .

Abstract

Carcinoembryonic antigen-related cell adhesion molecule 1 (CEACAM1) is expressed at high levels in the hepatocyte, consistent with its role in promoting insulin clearance in liver. CEACAM1 also mediates a negative acute effect of insulin on fatty acid synthase activity. Western blot analysis reveals lower hepatic CEACAM1 expression during fasting. Treating of rat hepatoma FAO cells with Wy14,643, an agonist of peroxisome proliferator-activated receptor α (PPARα), rapidly reduces Ceacam1 mRNA and CEACAM1 protein levels within 1 and 2 h, respectively. Luciferase reporter assay shows a decrease in the promoter activity of both rat and mouse genes by Pparα activation, and 5'-deletion and block substitution analyses reveal that the Pparα response element between nucleotides -557 and -543 is required for regulation of the mouse promoter activity. Chromatin immunoprecipitation analysis demonstrates binding of liganded Pparα toCeacam1promoter in liver lysates ofPparα(+/+), but notPparα(-/-)mice fed a Wy14,643-supplemented chow diet. Consequently, Wy14,643 feeding reduces hepatic Ceacam1 mRNA and CEACAM1 protein levels, thus decreasing insulin clearance to compensate for compromised insulin secretion and maintain glucose homeostasis and insulin sensitivity in wild-type mice. Together, the data show that the low hepatic CEACAM1 expression at fasting is mediated by Pparα-dependent mechanisms. Changes in CEACAM1 expression contribute to the coordination of fatty acid oxidation and insulin action in the fasting-refeeding transition.

Keywords: CEACAM1; PPAR response element; fatty acid metabolism; fatty acid synthase (FAS); gene expression; insulin clearance; insulin secretion; peroxisome proliferator-activated receptor (PPAR).


Figures

FIGURE 1.
FIGURE 1.
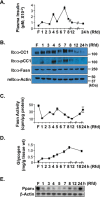
Changes in hepatic CEACAM1 protein content at fasting/refeeding and physiologic implications. A, mice were fasted (F) overnight and refed ad libitum for 1–24 h (Rfd) before assessing plasma insulin levels. B, liver lysates were subjected to Western analysis by immunoblotting (Ib) with antibodies against α-CEACAM1 (α-CC1) to assess changes in hepatic CEACAM1 protein levels, phospho-CEACAM1 (α-pCC1) to detect phosphorylated CEACAM1, and Fasn to detect protein content of fatty acid synthase. Gels were reimmunoblotted (reIb) with an antibody against actin to normalize for protein loading. Liver tissues were assayed for fatty acid synthase activity relative to microgram of proteins (C) and for glycogen content relative to wet tissue weight (D). Assays were carried out in triplicate and on more than three mice per each time point. Data are presented as the mean ± S.E. E, liver tissues were subjected to Northern analysis to assess hepatic Pparα mRNA levels followed by β-actin for normalization. Both Northern and Western gels represent more than three experiments done on more than three mice per each time point.
FIGURE 2.
FIGURE 2.
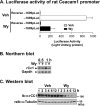
Regulation of rat Ceacam1 expression by PPARα activation. A, a rat Ceacam1 promoter fragment spanning a genomic DNA sequence from nt −1609 to −21 was subcloned into a promoterless luciferase reporter plasmid in both sense and reverse orientations. The constructs were transiently co-transfected with Renilla luciferase (pRL) into rat FAO hepatoma cells and treated with 30 μm Wy,14,463 (Wy) before luciferase activity was assayed, determined relative to that in Renilla, and expressed as the mean ± S.D. of triplicate transfections in relative light units. The graph represents four separate experiments. B, rat FAO cells were treated with ethanol (−) or Wy (+) for 0–1 h and analyzed by Northern blot using a Gapdh cDNA probe for normalization. rCC1, rat CC1. C, Rat FAO cells were treated with ethanol (Veh) or Wy for 0–12 h and subjected to Western blot (Ib) to analyze CEACAM1 protein content followed by tubulin for normalization. Each gel represents more than three different experiments.
FIGURE 3.
FIGURE 3.
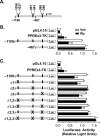
The effect of PPARα activation on mouse Ceacam1 promoter activity. A, sequence analysis of the mouse Ceacam1 promoter revealed three potential PPRE/RXR elements for potential Pparα binding: nts −1056/−1037, −557/−543, and −260/−248. B, as above, 5′-deletion constructs from the mouse promoter were subcloned into pGL4.10 promoterless luciferase reporter plasmid and transfected in HepG2 human hepatoma cells. Luciferase activity was determined in transfected cells treated with (black bars) or without (white bars) 30 μm Wy14,643 (Wy). As the negative control, cells were transfected with the empty pGL4.10. As a positive control, cells were transfected with PPREx3-TK plasmid. C, a series of constructs from nt −1100 to +30 mouse promoter bearing block mutations on individual or combinational PPRE/RXR sites were generated and subcloned into the pGL4.10 promoterless plasmid before their luciferase activity in response to ethanol (Veh) or Wy was determined as above. Luciferase light units were expressed as the mean ± S.D. in relative light units. The graph represents typical results from four separate experiments.
FIGURE 4.
FIGURE 4.
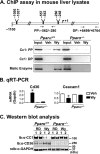
Regulation of mouse Ceacam1 expression by PPARα. A, Pparα+/+and Pparα−/− mice were fed a Wy-supplemented diet for 7 days before liver extraction and ChIP analysis as described under “Experimental Procedures.” The relative location of the fragment amplified using the proximal (PP; −548/−282) and distal (DP; +6499/+6764) primers in the Ceacam1 (Cc1) gene are also shown. Malic enzyme, a positive target of PPARα, was used as the control. The gel represents experiments on more than three mice per treatment category per mouse group. Wy, Wy14,643. reIb, reimmunoblot. B, livers were removed from mice treated with Wy for 7 days to analyze mRNA levels of Ceacam1 and CD36, a transcriptional target gene of PPARα, by quantitative real-time-PCR analysis. Analysis of each mouse was done in triplicate, and values are represented as the mean ± S.E. C, as in B, livers were removed to determine protein content by Western blot (Ib) analysis. Analyses were done on more than five mice per treatment per mouse group. Two mice from each feeding category per mouse group are shown.
FIGURE 5.
FIGURE 5.
Effect of PPARα activation on hepatocytic insulin uptake. Primary hepatocytes were isolated from mice and treated with either ethanol (Veh) or Wy,14,463 (Wy) as above. A, cell lysates were subjected to Western analysis (Ib) with α-CEACAM1 antibody (α-CC1) followed by reimmunoblotting (reIb) with α-GAPDH antibody to examine CEACAM1 protein content normalized to GAPDH. AU, arbitrary units. B, [125I]insulin internalization was determined in primary hepatocytes pretreated with either ethanol (Veh; solid lines) or Wy (dashed lines) as a first step in insulin degradation and clearance. After binding, [125I]insulin was allowed to internalize at 37 °C for 0–90 min (horizontal axis). Internalized ligand was plotted on the vertical axis as the percent of specifically bound ligand. Experiments were done in triplicate. Values are expressed as the mean ± S.D. The graph is representative of more than three experiments.
FIGURE 6.
FIGURE 6.
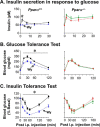
Metabolic effect of PPARα activation on insulin secretion and action. A, 2-month-old mice were fed a regular diet supplemented with Wy,14,463 (Wy) (dashed lines) or with vehicle alone (solid lines) for 3–7 days. A, acute-phase insulin release in response to glucose was assessed at 0–30 min post-injection. B, mice were challenged with an intraperitoneally injection of glucose to assess blood glucose levels at 0–120 min. C, mice were challenged with an intraperitoneally injection of insulin to assess blood glucose levels at 0–180 min. *, p < 0.05 Wy versus Veh in each mouse group (n > 6 per feeding group). i.p., intraperitoneal.
FIGURE 7.
FIGURE 7.
Mechanism of regulation of fatty acid oxidation by CEACAM1 during fasting-refeeding transition. As the schematic diagram (modified from Ref. 34) depicts, fatty acids (FA) are transported to the mitochondria by carnitine palmitoyltransferase I (CPT1) to undergo β-oxidation and produce acetyl-CoA at fasting (left arm). Acetyl-CoA strongly inhibits pyruvate dehydrogenase (PDH; thick red line) to prevent glycolysis (right arm) and reroute pyruvate to gluconeogenesis. This also leads to accumulation of citrate in the cytoplasm and, subsequently, inhibition of 6-phosphofructo-1-kinase (PFK1) and the rise in glucose-6-phosphate (G-6-P), which in turn inhibits hexokinase (HK) and ultimately mediates glycogen repletion (green arrows). At the end of the completion of glycogen replenishment (within ∼8 h of refeeding), β-oxidation stops, mediated largely by the gradual recovery of malonyl-CoA levels and its inhibition of carnitine palmitoyltransferase I activity. The current studies propose that the pulsatile release of insulin in the early hours of refeeding elevates CEACAM1 expression and its tyrosine phosphorylation (pY) by the insulin receptor (IR) to cause its binding to fatty acid synthase (FAS) and reduction of its activity, thus, contributing to the gradual increase in malonyl-CoA levels and inhibition of carnitine palmitoyltransferase I (dashed lines). In this manner, reduction of CEACAM1 transcription by PPARα activation at fasting and its stimulation by insulin positions CEACAM1 to contribute to the regulation of fatty acid β-oxidation in the fasting-refeeding transition, as mediated by the coordinated action of PPARα and pulsatile insulin surges in the early hours of refeeding. LCFAcyl-CoA, long chain fatty acyl CoA.

References

    1. Goodarzi M. O., Cui J., Chen Y. D., Hsueh W. A., Guo X., and Rotter J. I. (2011) Fasting insulin reflects heterogeneous physiological processes: role of insulin clearance. Am. J. Physiol. Endocrinol. Metab. 301, E402–E408 - PMC - PubMed
    1. Ader M., Stefanovski D., Kim S. P., Richey J. M., Ionut V., Catalano K. J., Hucking K., Ellmerer M., Van Citters G., Hsu I. R., Chiu J. D., Woolcott O. O., Harrison L. N., Zheng D., Lottati M., Kolka C. M., Mooradian V., Dittmann J., Yae S., Liu H., Castro A. V., Kabir M., and Bergman R. N. (2014) Hepatic insulin clearance is the primary determinant of insulin sensitivity in the normal dog. Obesity 22, 1238–1245 - PMC - PubMed
    1. Najjar S. M., Philippe N., Suzuki Y., Ignacio G. A., Formisano P., Accili D., and Taylor S. I. (1995) Insulin-stimulated phosphorylation of recombinant pp120/HA4, an endogenous substrate of the insulin receptor tyrosine kinase. Biochemistry 34, 9341–9349 - PubMed
    1. Formisano P., Najjar S. M., Gross C. N., Philippe N., Oriente F., Kern-Buell C. L., Accili D., and Gorden P. (1995) Receptor-mediated internalization of insulin: potential role of pp120/HA4, a substrate of the insulin receptor kinase. J. Biol. Chem. 270, 24073–24077 - PubMed
    1. Poy M. N., Yang Y., Rezaei K., Fernström M. A., Lee A. D., Kido Y., Erickson S. K., and Najjar S. M. (2002) CEACAM1 regulates insulin clearance in liver. Nat. Genet. 30, 270–276 - PubMed

Publication types

MeSH terms