

Tuning of the Na,K-ATPase by the beta subunit
- PMID: 26847162
- PMCID: PMC4742777
- DOI: 10.1038/srep20442
Tuning of the Na,K-ATPase by the beta subunit
Abstract
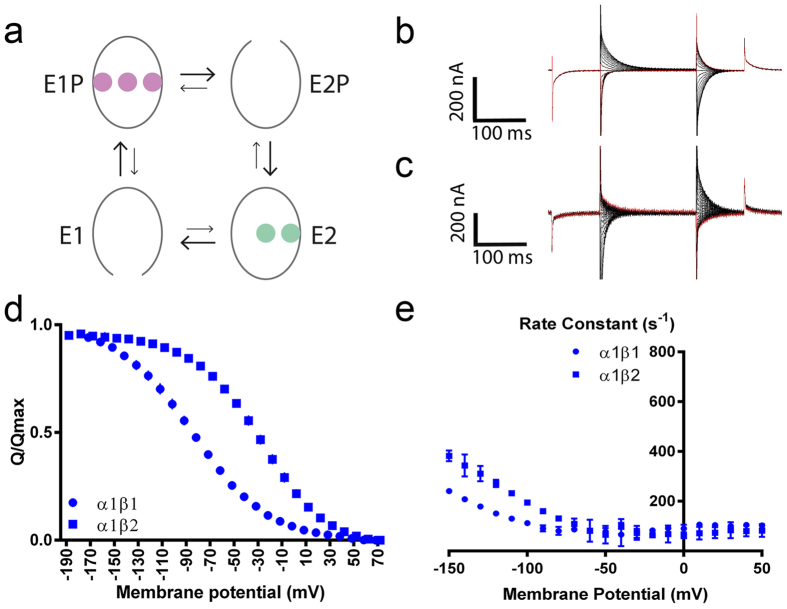
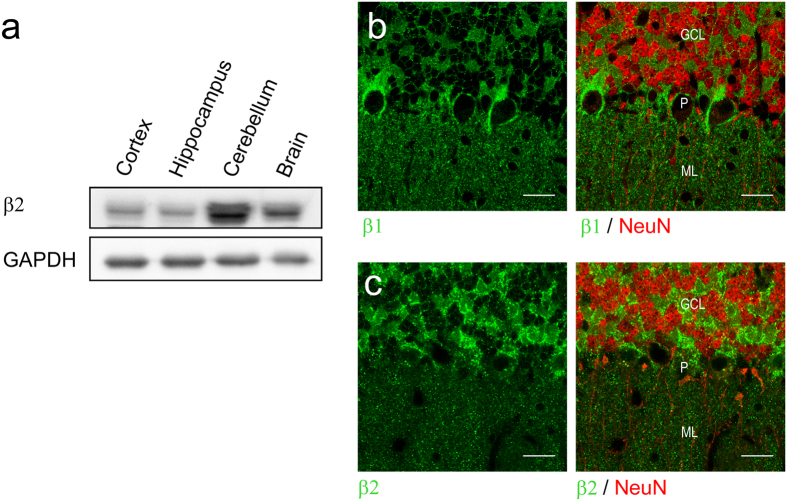
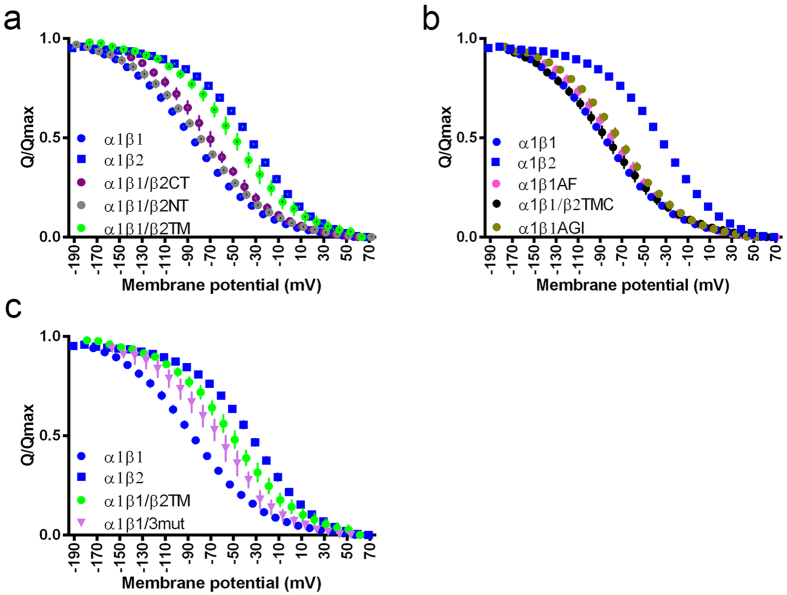
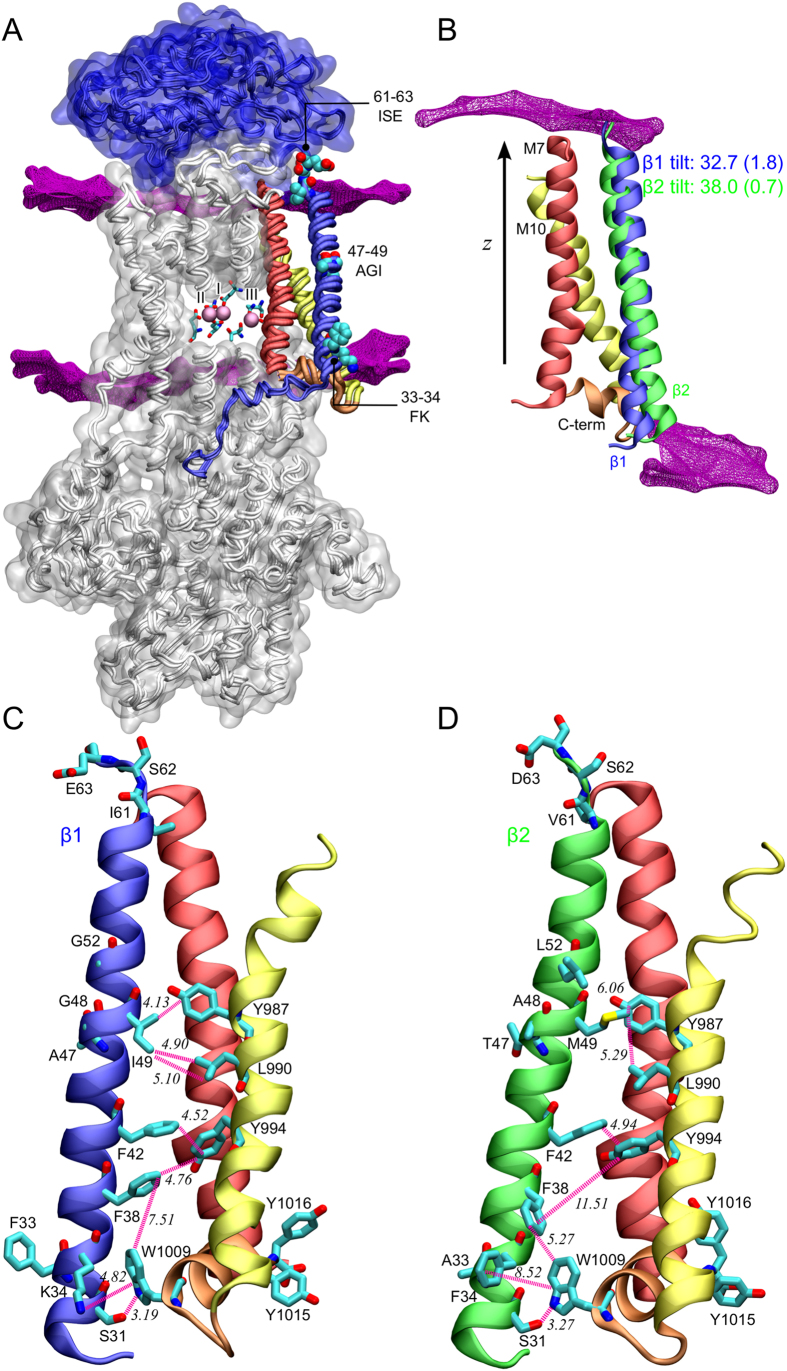
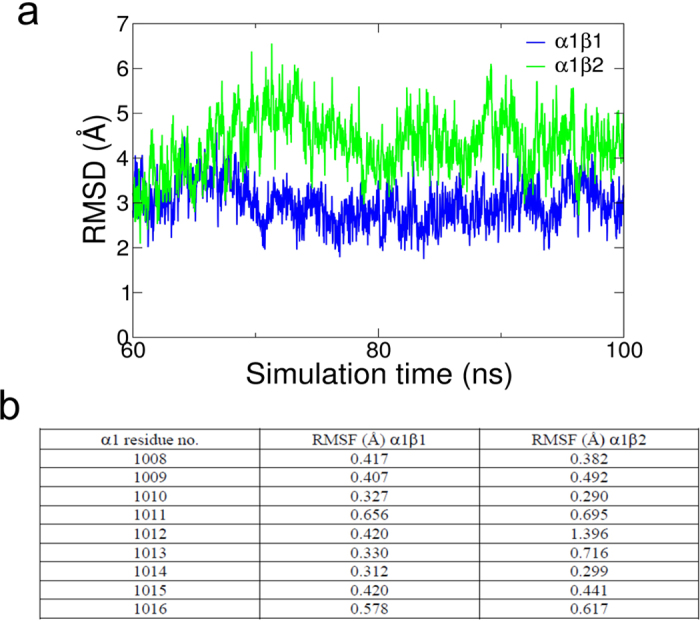
The vital gradients of Na(+) and K(+) across the plasma membrane of animal cells are maintained by the Na,K-ATPase, an αβ enzyme complex, whose α subunit carries out the ion transport and ATP hydrolysis. The specific roles of the β subunit isoforms are less clear, though β2 is essential for motor physiology in mammals. Here, we show that compared to β1 and β3, β2 stabilizes the Na(+)-occluded E1P state relative to the outward-open E2P state, and that the effect is mediated by its transmembrane domain. Molecular dynamics simulations further demonstrate that the tilt angle of the β transmembrane helix correlates with its functional effect, suggesting that the relative orientation of β modulates ion binding at the α subunit. β2 is primarily expressed in granule neurons and glomeruli in the cerebellum, and we propose that its unique functional characteristics are important to respond appropriately to the cerebellar Na(+) and K(+) gradients.
Figures
Similar articles
-
The beta subunit of the Na+/K+-ATPase follows the conformational state of the holoenzyme.J Gen Physiol. 2005 May;125(5):505-20. doi: 10.1085/jgp.200409186. J Gen Physiol. 2005. PMID: 15851504 Free PMC article.
-
Fluorometric measurements of intermolecular distances between the alpha- and beta-subunits of the Na+/K+-ATPase.J Biol Chem. 2006 Nov 24;281(47):36338-46. doi: 10.1074/jbc.M604788200. Epub 2006 Sep 15. J Biol Chem. 2006. PMID: 16980302
-
Structural arrangement and conformational dynamics of the gamma subunit of the Na+/K+-ATPase.Biochemistry. 2008 Jan 8;47(1):257-66. doi: 10.1021/bi701799b. Epub 2007 Dec 15. Biochemistry. 2008. PMID: 18081317
-
Aspects of gene structure and functional regulation of the isozymes of Na,K-ATPase.Cell Mol Biol (Noisy-le-grand). 2001 Mar;47(2):231-8. Cell Mol Biol (Noisy-le-grand). 2001. PMID: 11354995 Review.
-
Na+,K+-ATPase: structure, mechanism, and regulation.Membr Cell Biol. 2000;13(6):721-44. Membr Cell Biol. 2000. PMID: 10963432 Review.
Cited by
-
Insights into the Pathology of the α3 Na(+)/K(+)-ATPase Ion Pump in Neurological Disorders; Lessons from Animal Models.Front Physiol. 2016 Jun 14;7:209. doi: 10.3389/fphys.2016.00209. eCollection 2016. Front Physiol. 2016. PMID: 27378932 Free PMC article. Review.
-
Na+/K+-ATPase: More than an Electrogenic Pump.Int J Mol Sci. 2024 Jun 1;25(11):6122. doi: 10.3390/ijms25116122. Int J Mol Sci. 2024. PMID: 38892309 Free PMC article. Review.
-
A SINE Insertion in ATP1B2 in Belgian Shepherd Dogs Affected by Spongy Degeneration with Cerebellar Ataxia (SDCA2).G3 (Bethesda). 2017 Aug 7;7(8):2729-2737. doi: 10.1534/g3.117.043018. G3 (Bethesda). 2017. PMID: 28620085 Free PMC article.
-
Mineralocorticoids modulate the expression of the β-3 subunit of the Na+, K+-ATPase in the renal collecting duct.Channels (Austin). 2017 Sep 3;11(5):388-398. doi: 10.1080/19336950.2017.1344800. Epub 2017 Jun 21. Channels (Austin). 2017. PMID: 28636485 Free PMC article.
-
A novel ATP1A2 mutation in a patient with hypokalaemic periodic paralysis and CNS symptoms.Brain. 2018 Dec 1;141(12):3308-3318. doi: 10.1093/brain/awy283. Brain. 2018. PMID: 30423015 Free PMC article.
References
-
- Morth J. P. et al. Crystal structure of the sodium-potassium pump. Nature 450, 1043–1049 (2007). - PubMed
-
- Shinoda T., Ogawa H., Cornelius F. & Toyoshima C. Crytal Structure of the sodium-potassium pump at 2.4A resolution. Nature 459, 446–451 (2009). - PubMed
-
- Toyoshima C., Kanai R. & Cornelius F. First Crystal Structures of Na+,K+-ATPase: New Light on the Oldest Ion Pump. Structure 19, 1732–1738 (2011). - PubMed
-
- Kanai R., Ogawa H., Vilsen B., Cornelius F. & Toyoshima C. Crystal structure of a Na+-bound Na+,K+-ATPase preceding the E1P state. Nature 502, 201–6 (2013). - PubMed
-
- Nyblom M. et al. Crystal Structure of Na+, K+-ATPase in the Na+-Bound State. Science (80-.). 342, 123–127 (2013). - PubMed
Publication types
MeSH terms
Substances
LinkOut - more resources
Full Text Sources
Other Literature Sources
