SPARTA: Simple Program for Automated reference-based bacterial RNA-seq Transcriptome Analysis
- PMID: 26847232
- PMCID: PMC4743240
- DOI: 10.1186/s12859-016-0923-y
SPARTA: Simple Program for Automated reference-based bacterial RNA-seq Transcriptome Analysis
Abstract
Background: Many tools exist in the analysis of bacterial RNA sequencing (RNA-seq) transcriptional profiling experiments to identify differentially expressed genes between experimental conditions. Generally, the workflow includes quality control of reads, mapping to a reference, counting transcript abundance, and statistical tests for differentially expressed genes. In spite of the numerous tools developed for each component of an RNA-seq analysis workflow, easy-to-use bacterially oriented workflow applications to combine multiple tools and automate the process are lacking. With many tools to choose from for each step, the task of identifying a specific tool, adapting the input/output options to the specific use-case, and integrating the tools into a coherent analysis pipeline is not a trivial endeavor, particularly for microbiologists with limited bioinformatics experience.
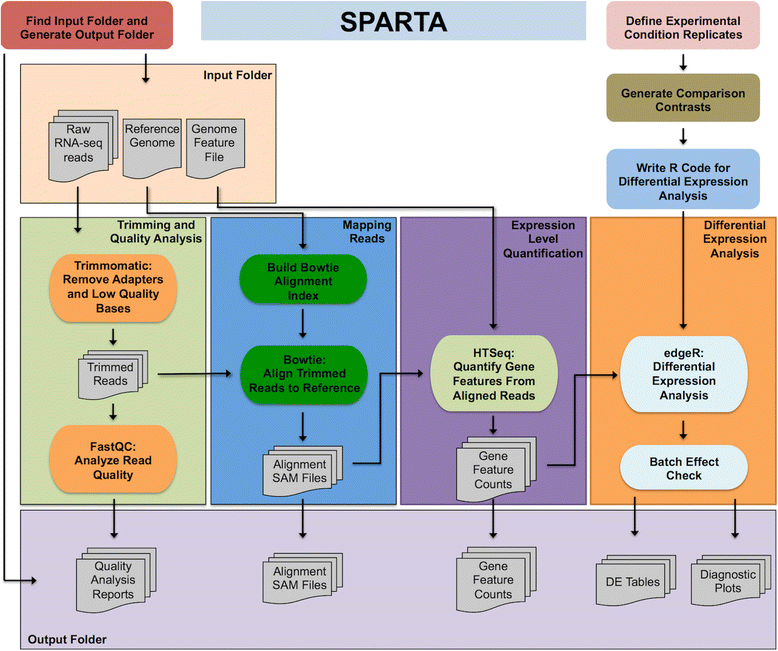
Results: To make bacterial RNA-seq data analysis more accessible, we developed a Simple Program for Automated reference-based bacterial RNA-seq Transcriptome Analysis (SPARTA). SPARTA is a reference-based bacterial RNA-seq analysis workflow application for single-end Illumina reads. SPARTA is turnkey software that simplifies the process of analyzing RNA-seq data sets, making bacterial RNA-seq analysis a routine process that can be undertaken on a personal computer or in the classroom. The easy-to-install, complete workflow processes whole transcriptome shotgun sequencing data files by trimming reads and removing adapters, mapping reads to a reference, counting gene features, calculating differential gene expression, and, importantly, checking for potential batch effects within the data set. SPARTA outputs quality analysis reports, gene feature counts and differential gene expression tables and scatterplots.
Conclusions: SPARTA provides an easy-to-use bacterial RNA-seq transcriptional profiling workflow to identify differentially expressed genes between experimental conditions. This software will enable microbiologists with limited bioinformatics experience to analyze their data and integrate next generation sequencing (NGS) technologies into the classroom. The SPARTA software and tutorial are available at sparta.readthedocs.org.
Figures


References
Publication types
MeSH terms
Substances
Grants and funding
LinkOut - more resources
Full Text Sources
Other Literature Sources
Molecular Biology Databases

