Use of metabolomics for the chemotaxonomy of legume-associated Ascochyta and allied genera
- PMID: 26847260
- PMCID: PMC4742866
- DOI: 10.1038/srep20192
Use of metabolomics for the chemotaxonomy of legume-associated Ascochyta and allied genera
Abstract
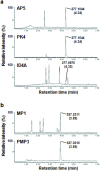
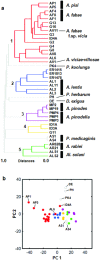
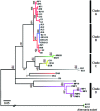
Chemotaxonomy and the comparative analysis of metabolic features of fungi have the potential to provide valuable information relating to ecology and evolution, but have not been fully explored in fungal biology. Here, we investigated the chemical diversity of legume-associated Ascochyta and Phoma species and the possible use of a metabolomics approach using liquid chromatography-mass spectrometry for their classification. The metabolic features of 45 strains including 11 known species isolated from various legumes were extracted, and the datasets were analyzed using chemometrics methods such as principal component and hierarchical clustering analyses. We found a high degree of intra-species consistency in metabolic profiles, but inter-species diversity was high. Molecular phylogenies of the legume-associated Ascochyta/Phoma species were estimated using sequence data from three protein-coding genes and the five major chemical groups that were detected in the hierarchical clustering analysis were mapped to the phylogeny. Clusters based on similarity of metabolic features were largely congruent with the species phylogeny. These results indicated that evolutionarily distinct fungal lineages have diversified their metabolic capacities as they have evolved independently. This whole metabolomics approach may be an effective tool for chemotaxonomy of fungal taxa lacking information on their metabolic content.
Figures


Similar articles
-
Evolutionary relationships among Ascochyta species infecting wild and cultivated hosts in the legume tribes Cicereae and Vicieae.Mycologia. 2007 Jan-Feb;99(1):59-77. doi: 10.3852/mycologia.99.1.59. Mycologia. 2007. PMID: 17663124
-
Phytotoxic Metabolites Produced by Legume-Associated Ascochyta and Its Related Genera in the Dothideomycetes.Toxins (Basel). 2019 Oct 29;11(11):627. doi: 10.3390/toxins11110627. Toxins (Basel). 2019. PMID: 31671808 Free PMC article. Review.
-
Cloning and characterization of the mating type (MAT) locus from Ascochyta rabiei (teleomorph: Didymella rabiei) and a MAT phylogeny of legume-associated Ascochyta spp.Fungal Genet Biol. 2003 Jul;39(2):151-67. doi: 10.1016/s1087-1845(03)00015-x. Fungal Genet Biol. 2003. PMID: 12781674
-
Taxonomical re-evaluation of Phoma-like soybean pathogenic fungi.Mycol Res. 2009 Feb;113(Pt 2):249-60. doi: 10.1016/j.mycres.2008.11.003. Epub 2008 Nov 19. Mycol Res. 2009. PMID: 19049869
-
Phoma-like fungi on soybeans.Crit Rev Microbiol. 2014 Feb;40(1):49-62. doi: 10.3109/1040841X.2012.755948. Epub 2013 Jan 31. Crit Rev Microbiol. 2014. PMID: 23363325 Review.
Cited by
-
Generation of a Clean Host for Polyketide Production Using Agricultural Wastes in Ascochyta Rabiei.Mycobiology. 2025 Feb 13;53(2):225-235. doi: 10.1080/12298093.2025.2460292. eCollection 2025. Mycobiology. 2025. PMID: 40260317 Free PMC article.
-
The Application of Quantitative Metabolomics for the Taxonomic Differentiation of Birds.Biology (Basel). 2022 Jul 21;11(7):1089. doi: 10.3390/biology11071089. Biology (Basel). 2022. PMID: 36101467 Free PMC article.
-
Uncovering Phytotoxic Compounds Produced by Colletotrichum spp. Involved in Legume Diseases Using an OSMAC-Metabolomics Approach.J Fungi (Basel). 2023 May 25;9(6):610. doi: 10.3390/jof9060610. J Fungi (Basel). 2023. PMID: 37367546 Free PMC article.
-
Optimized High Throughput Ascochyta Blight Screening Protocols and Immunity to A. pisi in Pea.Pathogens. 2023 Mar 22;12(3):494. doi: 10.3390/pathogens12030494. Pathogens. 2023. PMID: 36986416 Free PMC article.
-
Ecological and Oceanographic Perspectives in Future Marine Fungal Taxonomy.J Fungi (Basel). 2022 Oct 28;8(11):1141. doi: 10.3390/jof8111141. J Fungi (Basel). 2022. PMID: 36354908 Free PMC article. Review.
References
-
- Aveskamp M. M., Gruyter J.d. & Crous P. W. Biology and recent developments in the systematics of Phoma, a complex genus of major quarantine significance. Fungal Divers 31, 1–18 (2008).
-
- Pedras M. C. & Biesenthal C. J. HPLC analyses of cultures of Phoma spp.: differentiation among groups and species through secondary metabolite profiles. Can J Microbiol 46, 685–691 (2000). - PubMed
-
- Sørensen J. L., Aveskamp M. M., Thrane U. & Andersen B. Chemical characterization of Phoma pomorum isolated from Danish maize. Int J Food Microbiol 136, 310–317 (2010). - PubMed
-
- Rabie C. J., van Rensburg S. J., van der Watt J. J. & Lubben A. Onyalai-the possible involvement of a mycotoxin produced by Phoma sorghina in the aetiology. S Afr Med J 57, 1647–1650 (1975). - PubMed
Publication types
MeSH terms
Substances
LinkOut - more resources
Full Text Sources
Other Literature Sources

