. 2016 Mar 18;351(6279):1329-33.
doi: 10.1126/science.aaf1648. Epub 2016 Feb 4.

Tuft cells, taste-chemosensory cells, orchestrate parasite type 2 immunity in the gut

Affiliations

Tuft cells, taste-chemosensory cells, orchestrate parasite type 2 immunity in the gut

Michael R Howitt et al. Science. .

Abstract

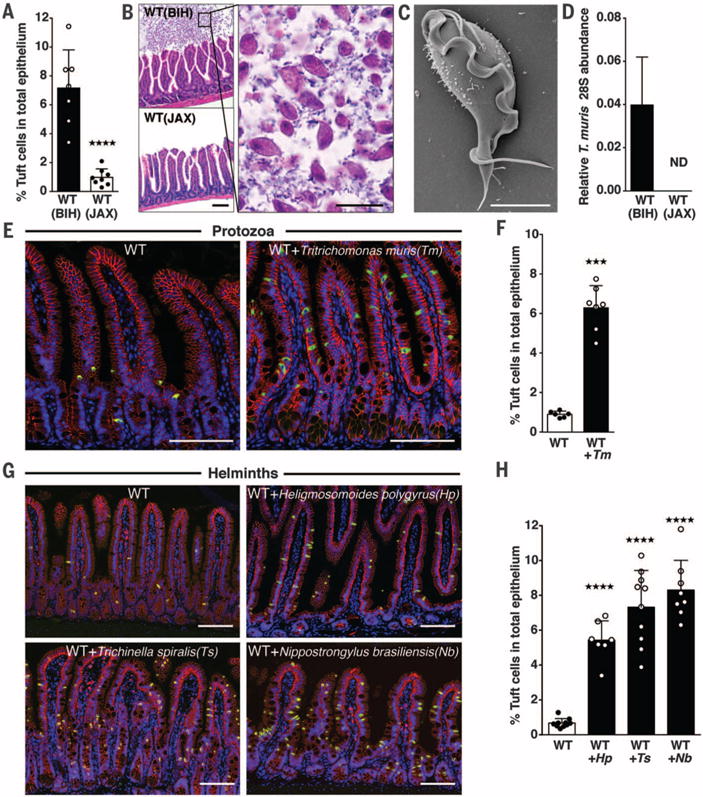
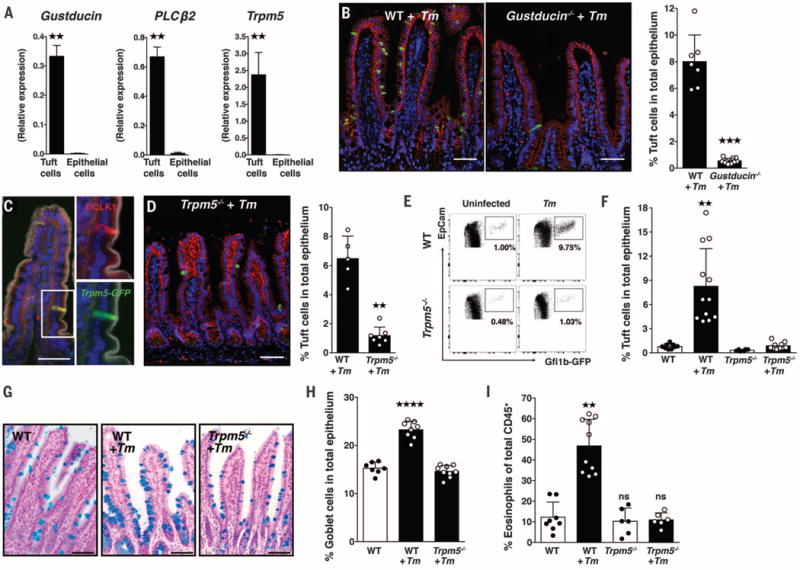
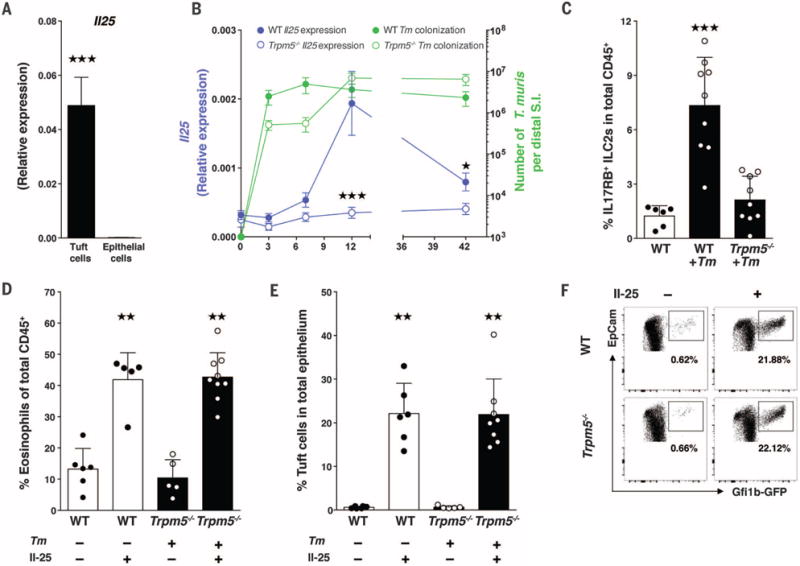
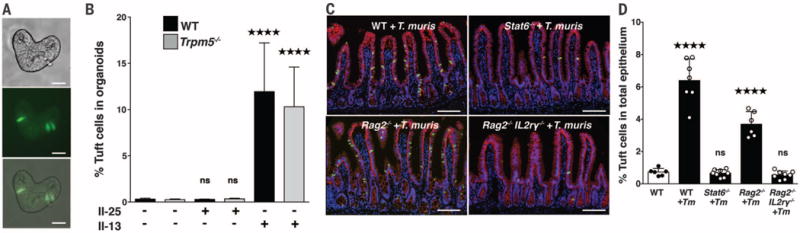
The intestinal epithelium forms an essential barrier between a host and its microbiota. Protozoa and helminths are members of the gut microbiota of mammals, including humans, yet the many ways that gut epithelial cells orchestrate responses to these eukaryotes remain unclear. Here we show that tuft cells, which are taste-chemosensory epithelial cells, accumulate during parasite colonization and infection. Disruption of chemosensory signaling through the loss of TRMP5 abrogates the expansion of tuft cells, goblet cells, eosinophils, and type 2 innate lymphoid cells during parasite colonization. Tuft cells are the primary source of the parasite-induced cytokine interleukin-25, which indirectly induces tuft cell expansion by promoting interleukin-13 production by innate lymphoid cells. Our results identify intestinal tuft cells as critical sentinels in the gut epithelium that promote type 2 immunity in response to intestinal parasites.


Conflict of interest statement

The authors declare no competing financial interests.

Figures

Fig. 1
Fig. 1. Symbiotic protozoa or helminths increase intestinal tuft cell abundance
(A) DCLK1+ tuft cell frequency in the small intestine (SI) of WT BIH and WT JAX mice. (B) Hemtoxylin and eosin-stained SI sections from WT BIH and WT JAX mice (scale bar, 50 μm) (left). A higher magnification of the WT BIH section is shown on the right (scale bar, 20 μm). (C) SEM micrograph of protozoa isolated from WT BIH mice (scale bar, 4 μm). (D) Tm abundance in stool DNA (Tm 28S rRNA relative to Eubacteria 16S rRNA), determined by qPCR (ND, not detectable). (E) Representative SI images from uninfected and Tm-colonized mice and (F) tuft cell frequency. (G) Representative SI images from uninfected and helminth-colonized mice and (H) tuft cell frequency. DCLK1 is shown in green, E-cadherin in red, and DAPI (4′,6-diamidino-2-phenylindole) in blue [scale bars in (E) and (G), 100 μm]. Each symbol represents an individual mouse, and all data are representative of two [(D), (F), and (H)] or three (A) independent experiments. Tm infection was 17 days in (E) and (F). In (G) and (H), Hp infection was 21 days, Ts infection was 15 days, and Nb infection was 8 days. Data are plotted as means with SD. Four stars, P < 0.0001; three stars, P = 0.0001; one-way analysis of variance (ANOVA) or Mann-Whitney test.
Fig. 2
Fig. 2. Tuft cells influence type 2 immunity through TRPM5
(A) Gustducin, PLCβ2, and TRPM5 expression in sorted tuft cells, compared with the non-tuft cell epithelium. (B) Representative images of Tm-colonized WT and gustducin−/− mice and tuft cell frequencies. (C) Representative image from Trpm5eGFP mice. GFP is shown in green), DCLK1 in red), DAPI in blue, and phalloidin in white. (D) Representative image of Tm-colonized Trpm5−/− mice and tuft cell frequencies. Scale bars in (B), (C), and (D), 50 μm. (E) Representative flow cytometry plots of IECs from uninfected (left) or Tm-colonized (right) WT (Gfi1beGFP/+, top) and Trpm5−/− (Gfi1beGFP/+ Trpm5−/−, bottom) mice and (F) tuft cell frequency. (G) Goblet cells in SI sections stained with Alcian blue and nuclear red in uninfected WT and Tm-colonized WT and Trpm5−/− mice and (H) goblet cell frequency. (I) Eosinophil frequency in the distal SI lamina propria (LP) of uninfected and Tm-colonized WT and Trpm5−/− mice. Scale bars, 50 μm. Each symbol represents an individual mouse, and all data are representative of at least three independent experiments. Data are plotted as means with SD. Four stars, P < 0.0001; three stars, P = 0.0001; two stars, P < 0.01; ns, not significant; one-way ANOVA, Kruskal-Wallis, or Mann-Whitney tests.
Fig. 3
Fig. 3. Tuft cells express IL-25 and elicit ILC2s in a TRPM5-dependent manner in response to symbiotic protozoa
(A) IL-25 expression from sorted tuft cells. (B) WT (solid circles) and Trpm5−/− (open circles) mice were colonized with Tm for 3, 7, 12, and 42 days. At each time point, epithelial cell IL-25 expression was measured (purple line) and Tm colonization was quantified (green line). (C) Frequency of IL17RB+ (IL-25R) ILC2s in the distal SI LP of uninfected WT mice and WT and Trpm5−/− mice colonized with Tm for 12 days. (D) Eosinophil frequency in the distal SI LP of uninfected WT or Tm-colonized Trpm5−/− mice intraperitoneally injected with IL-25 or phosphate-buffered saline (PBS) control. (E) Tuft cell frequencies and (F) flow plots of epithelial cells isolated from Trpm5−/− mice intraperitoneally injected with IL-25 or PBS. Each symbol in (C), (D), and (E) represents an individual mouse, and all data are representative of three independent experiments. Data are plotted as means with SD.Three stars, P < 0.001; two stars, P < 0.01; Kruskal-Wallis or Mann-Whitney tests.
Fig. 4
Fig. 4. Innate lymphoid cells and IL-13 increase tuft cells in organoids and the small intestine
(A) Differential interference contrast, fluorescent, and merged images of small intestinal organoids generated from Gfi1beGFP/+ mice (scale bars, 25 μm). (B) GFP+ tuft cell abundance by flow cytometry of WT and Trpm5−/− organoids treated with recombinant IL-13 or IL-25. (C) Representative images of SI from WT, Stat6−/−, Rag2−/−, and Rag2−/−Il2rγ−/− mice colonized with Tm and (D) tuft cell frequency. DCLK1 is shown in green, E-cadherin in red, and DAPI in blue (scale bars, 100 μm). Each symbol in (D) represents an individual mouse, and all data are representative of (D) two or (B) three independent experiments. Data are plotted as means with SD. Four stars, P < 0.0001; one-way ANOVA or Mann-Whitney tests.

Comment in

Similar articles

Cited by

References

    1. Kobayashi KS, et al. Science. 2005;307:731–734. - PubMed
    1. Rakoff-Nahoum S, Paglino J, Eslami-Varzaneh F, Edberg S, Medzhitov R. Cell. 2004;118:229–241. - PubMed
    1. Vaishnava S, Behrendt CL, Ismail AS, Eckmann L, Hooper LV. Proc Natl Acad Sci USA. 2008;105:20858–20863. - PMC - PubMed
    1. Vaishnava S, et al. Science. 2011;334:255–258. - PMC - PubMed
    1. Smith PM, et al. Science. 2013;341:569–573. - PMC - PubMed

Publication types

MeSH terms