. 2016 Feb 5:6:20460.
doi: 10.1038/srep20460.

KCTD12 Regulates Colorectal Cancer Cell Stemness through the ERK Pathway

Affiliations

KCTD12 Regulates Colorectal Cancer Cell Stemness through the ERK Pathway

Liping Li et al. Sci Rep. .

Abstract

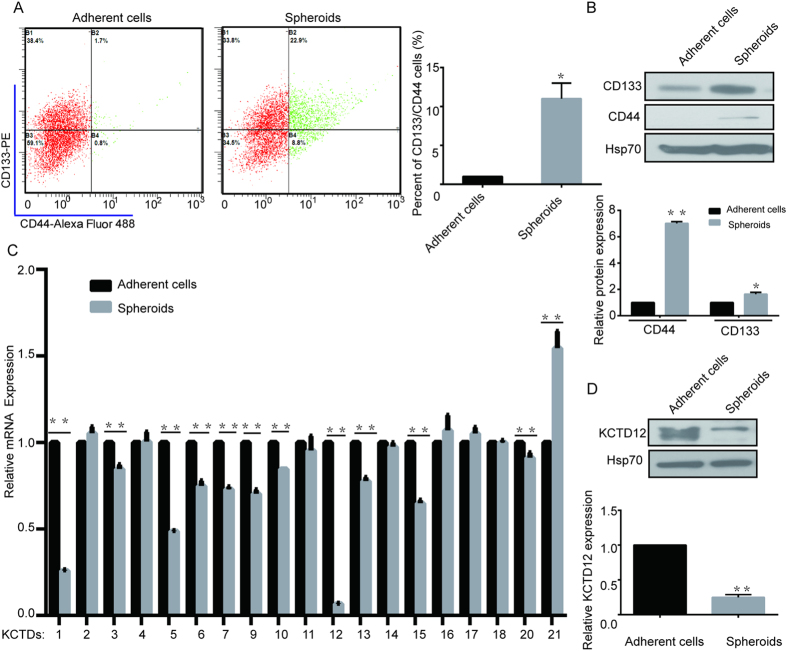
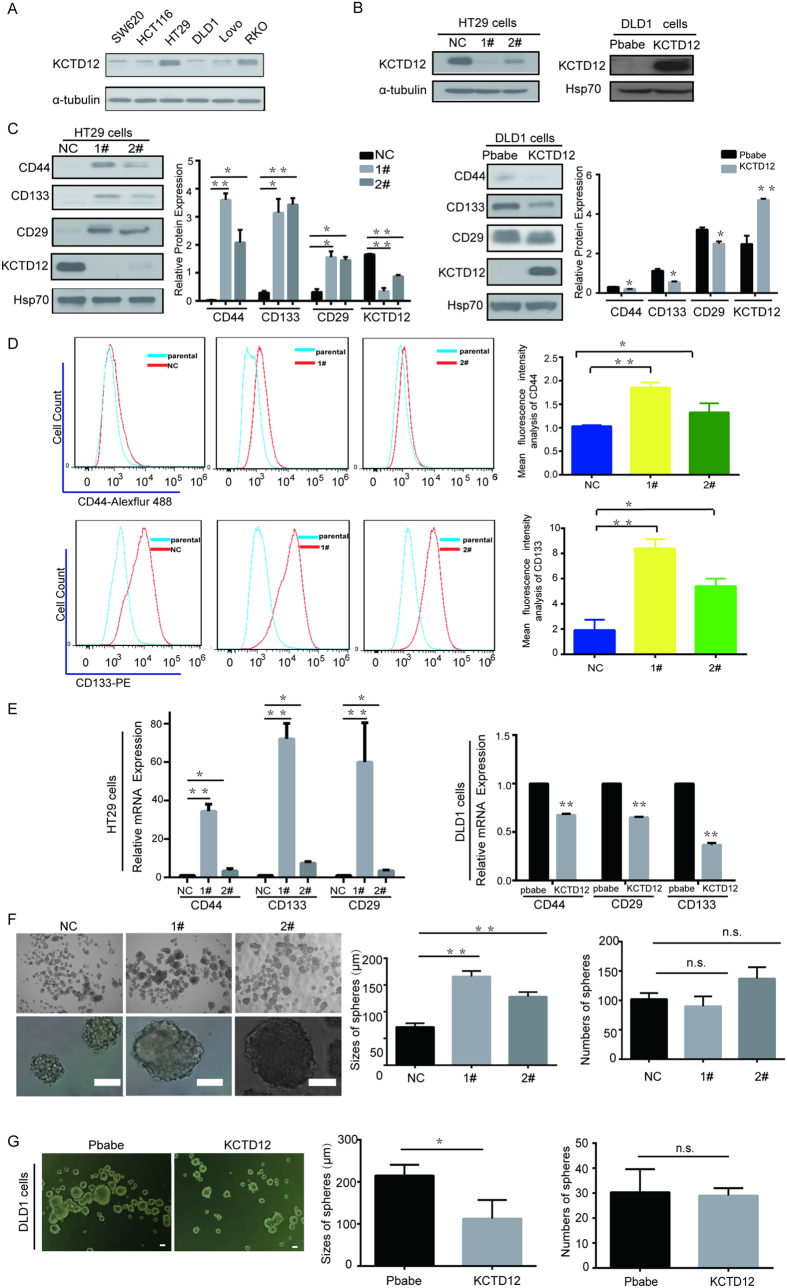
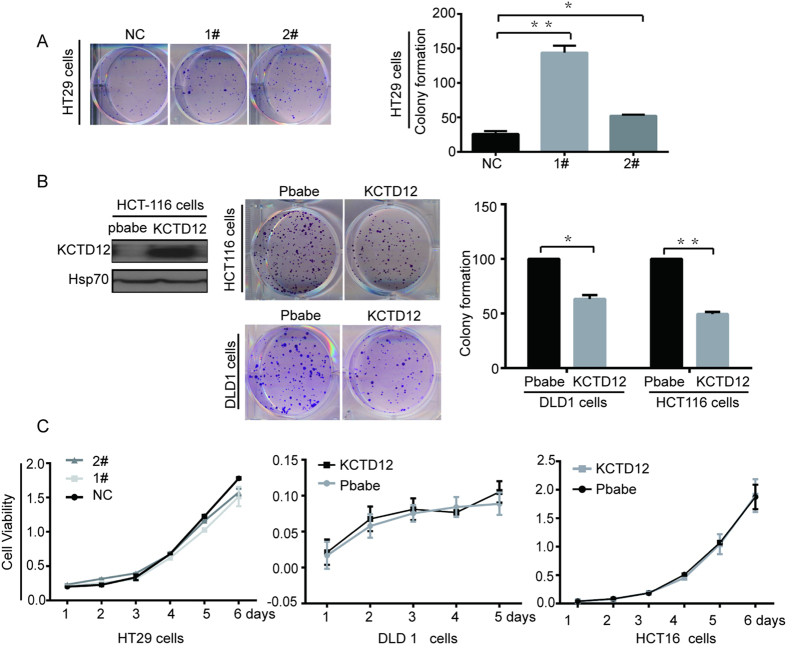
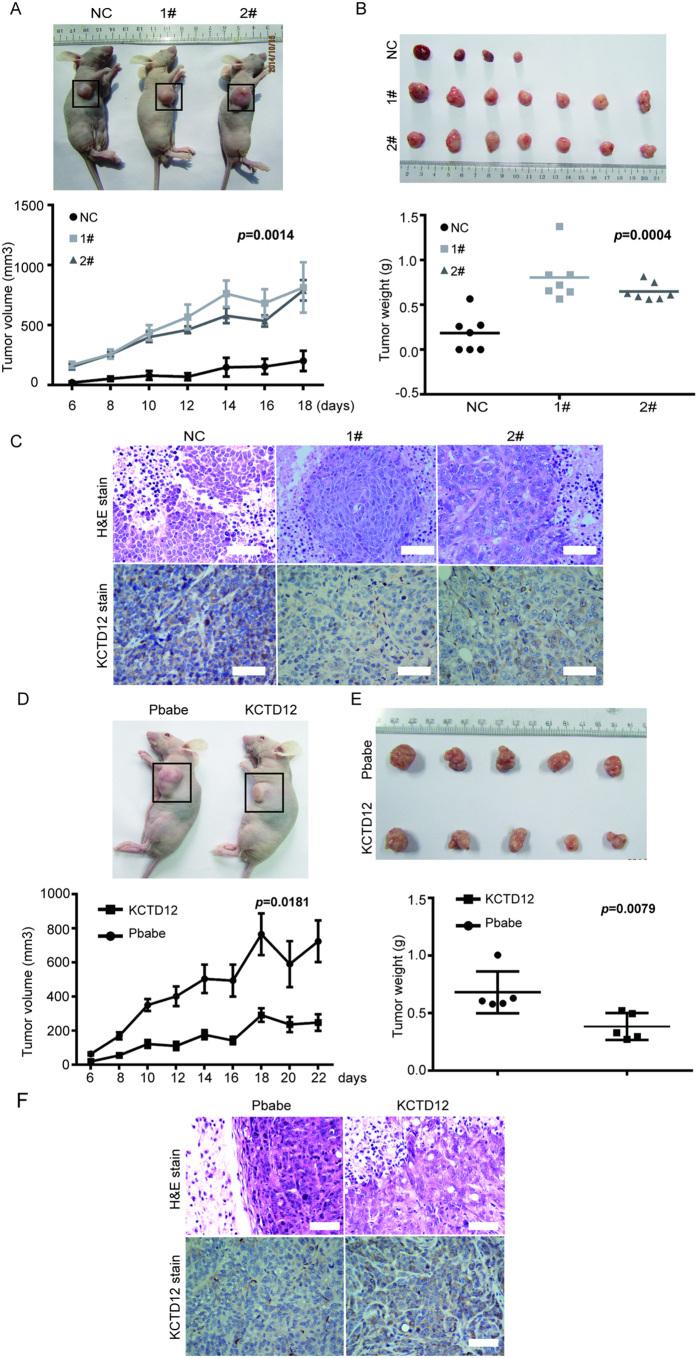
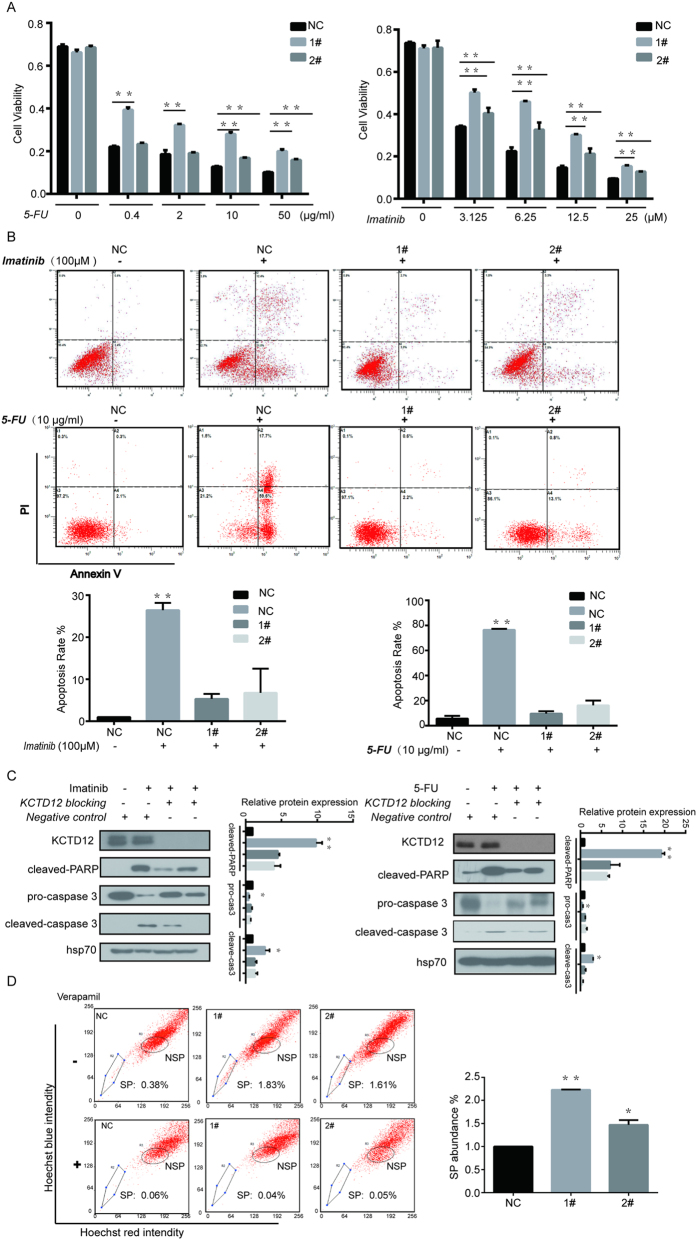
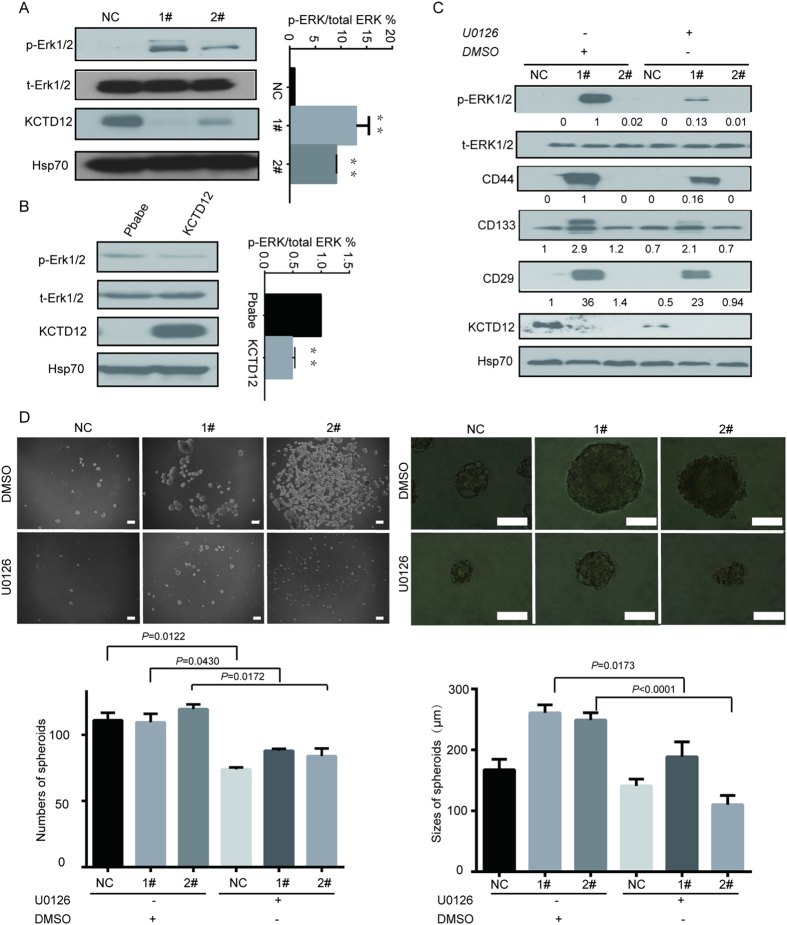
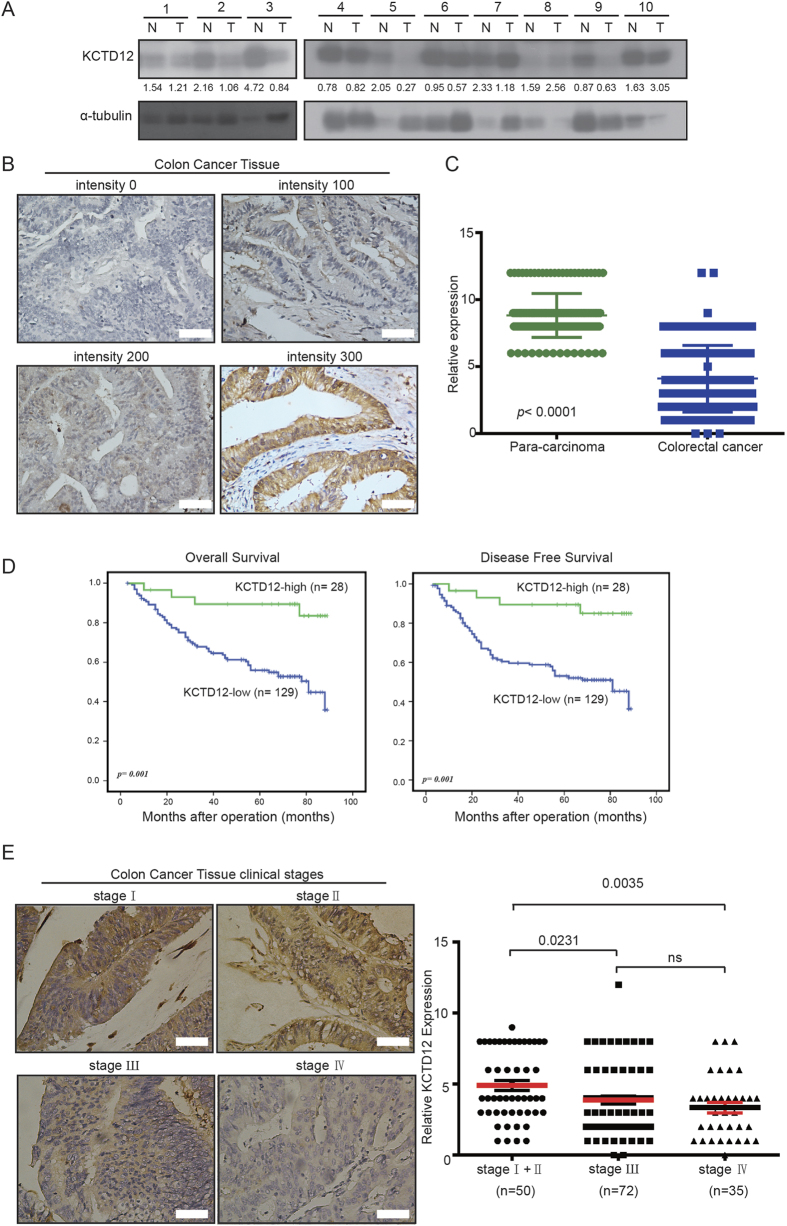
Targeting cancer stem cells (CSCs) in colorectal cancer (CRC) remains a difficult problem, as the regulation of CSCs in CRC is poorly understood. Here we demonstrated that KCTD12, potassium channel tetramerization domain containing 12, is down-regulated in the CSC-like cells of CRC. The silencing of endogenous KCTD12 and the overexpression of ectopic KCTD12 dramatically enhances and represses CRC cell stemness, respectively, as assessed in vitro and in vivo using a colony formation assay, a spheroid formation assay and a xenograft tumor model. Mechanistically, KCTD12 suppresses CRC cell stemness markers, such as CD44, CD133 and CD29, by inhibiting the ERK pathway, as the ERK1/2 inhibitor U0126 abolishes the increase in expression of CRC cell stemness markers induced by the down-regulation of KCTD12. Indeed, a decreased level of KCTD12 is detected in CRC tissues compared with their adjacent normal tissues and is an independent prognostic factor for poor overall and disease free survival in patients with CRC (p = 0.007). Taken together, this report reveals that KCTD12 is a novel regulator of CRC cell stemness and may serve as a novel prognostic marker and therapeutic target for patients with CRC.


Figures

Figure 1
Figure 1. KCTD12 is down-regulated in CSC-like HT29 cells.
(A) Representative flow cytometry plots and quantitative analysis showing the percentages of CD44+ and CD133+ cells in normal adherent and spheroid cultures of HT29 cells. (B) CD44 and CD133 expressions were analyzed by Western blotting in adherent and spheroid cultures of HT29 cells. (C) Quantitative real time PCR analysis of the relative mRNA levels of the KCTD family members in adherent and spheroid cultures of HT29 cells. (D) KCTD12 expression was analyzed by Western blotting in adherent and spheroid cultures of HT29 cells. The results are presented as the means ± SD, and all data are representative of three independent experiments. *P < 0.05, **P < 0.01.
Figure 2
Figure 2. KCTD12 suppresses the stemness of CRC cells.
(A) KCTD12 protein was analyzed by Western blotting in the indicated CRC cell lines. (B) The indicated stable cell lines with silencing or overexpression of KCTD12 were analyzed by Western blotting. α-tubulin or HSP70 was used as the loading control. (C-E) CD44, CD133 and CD29 levels were analyzed by Western blotting, qRT-PCR and flow cytometry, in the indicated stable cell lines. Red lines indicating the mean intensity of fluorescence of CD44+ or CD133+ were quantified by Flow-J software in the flow cytometry analysis. The mean intensity of fluorescence of CD44+ or CD133+ was calculated in triplicates. (F,G) Images and quantification of the number and size of spheres formed from the indicated stable cell lines in the absence of serum for 7 days. Original magnification in F, 40×(upper), 400×(lower). Original magnification in G, 40×. Scale bars, 100 μm. The results are presented as the means ± SD, and all data are representative of three independent experiments. *P < 0.05, **P < 0.01.
Figure 3
Figure 3. KCTD12 inhibits the colony formation of CRC cells in vitro.
(A,B) The colony formation assays were performed in the indicated stable cell lines. (C) The cell proliferation was measured by MTT in the indicated stable cell lines. The results are presented as the means ± S.E. of three independent experiments. *P < 0.05, **P < 0.01.
Figure 4
Figure 4. KCTD12 represses the tumorigenicity of CRC cells in vivo.
(A,B) A xenograft model consisting of nude mice with HT29 cells harboring KCTD12 silencing injected into the armpits of 4 week old mice (n = 7/group). The images of mice harboring tumors (left) and tumors from the mice (right). Tumor volumes were measured every two days (left). Mean tumor weights were calculated. (D,E) A xenograft model consisting of nude mice with DLD1 cells overexpressing KCTD12 were injected into the armpits of 4 week old mice (n = 5/group). The images of mice harboring tumors (left) and tumors from the mice (right). Tumor volumes were measured every two days (left). Mean tumor weights were calculated. The results are presented as the means ± SD. *P < 0.05, **P < 0.01. (C,F) H&E staining of tumors and IHC staining for KCTD12 protein in these cells. Original magnification, 200×. Scale bars, 100 μm.
Figure 5
Figure 5. Silencing of KCTD12 enhances the drug resistance to both imatinib and 5-FU in HT29 cells.
(A) HT29 cells with silenced KCTD12 were seeded in 96-well plates at a density of 5 × 103 per well and treated with increasing concentrations of imatinib and 5-FU, as indicated. Cell viabilities were detected by the MTT assay. (B) HT29 cells with silenced KCTD12 were seeded in 6-well plates at a density of 5 × 105 per well and treated with 100 μM imatinib for 24 h or 10 μg/ml 5-FU for 48 h, as indicated. The apoptosis rates were detected with the Annexin ν/PI kit and analyzed by flow cytometry. (C) Western blotting analysis of cleaved-PARP, procaspase3 and cleaved caspase 3. The experiments were repeated three times. (D) The side population (SP) cells assay. HT29 cells with silenced KCTD12 were treated with 50 μg/ml verapamil and 0.1 μg/ml Hoechst 33342 dye and subjected to flow cytometric analysis. Representative flow cytometric histograms demonstrating a distinct SP cells fractions. The quantified results were presented as the means ± SD (n = 3). *P < 0.05, **P < 0.01.
Figure 6
Figure 6. KCTD12 regulates stemness of CRC cells via the ERK signaling pathway.
(A,B) Phosphorylation of ERK1/2 (p-ERK1/2) and total ERK1/2 (t-ERK1/2) were detected using western blotting in the indicated stable cell lines. (C) HT29 cells with silenced KCTD12 were treated with U0126 (30 μM) for 24 h. Western blotting was performed to detect t-ERK1/2, p-ERK1/2, CD44, CD133 and CD29. Hsp70 was used as a loading control. (D) The sphere formation assays were performed in HT29 cells with silenced KCTD12 and treated with U0126 or DMSO for 7 days. Images and quantification of the numbers and sizes of spheres formed were calculated. The experiments were repeated three times. *P < 0.05, **P < 0.01. Scale bars, 200 μm (left) and 100 μm (right).
Figure 7
Figure 7. Low expression of KCTD12 was detected in human colorectal cancer tissues.
(A) The KCTD12 protein levels in CRC tumor tissues (T) and their adjacent normal tissues (N) were analyzed by western blotting. (B) The KCTD12 protein levels in 157 CRC tissues were analyzed by IHC. The images represented differential staining intensities of KCTD12. (C) The relative KCTD12 expression levels were analyzed based on scores, and the results were shown as the means ± SD. (D) The correlation between KCTD12 expression and overall survival rate (p = 0.001) and disease free survival rate (p = 0.001) of CRC patients (n = 157) were determined using Kaplan-Meier survival and log-rank analysis. (E) The images represented differential KCTD12 staining intensities in different clinical stages (left). The correlation between KCTD12 expression and the clinical stage were analyzed between stageI/II, stage Ш and stage IV. Stage I and Stage II cases were combined into one group. *P < 0.05, **P < 0.01.

Similar articles

Cited by

References

    1. Brenner H., Kloor M. & Pox C. P. Colorectal cancer. Lancet 383, 1490–1502, doi: 10.1016/S0140-6736(13)61649-9 (2014). - DOI - PubMed
    1. Siegel R., Desantis C. & Jemal A. Colorectal cancer statistics, 2014. CA Cancer J Clin 64, 104–117, doi: 10.3322/caac.21220 (2014). - DOI - PubMed
    1. Vaiopoulos A. G., Kostakis I. D., Koutsilieris M. & Papavassiliou A. G. Colorectal cancer stem cells. Stem Cells 30, 363–371, doi: 10.1002/stem.1031 (2012). - DOI - PubMed
    1. Ricci-Vitiani L. et al.. Identification and expansion of human colon-cancer-initiating cells. Nature 445, 111–115, doi: 10.1038/nature05384 (2007). - DOI - PubMed
    1. Dean M., Fojo T. & Bates S. Tumour stem cells and drug resistance. Nat Rev Cancer 5, 275–284, doi: 10.1038/nrc1590 (2005). - DOI - PubMed

Publication types

MeSH terms