. 2016 Jun 15;594(12):3209-25.
doi: 10.1113/JP271703. Epub 2016 Mar 4.

Physiological signalling to myosin phosphatase targeting subunit-1 phosphorylation in ileal smooth muscle

Affiliations

Physiological signalling to myosin phosphatase targeting subunit-1 phosphorylation in ileal smooth muscle

Ning Gao et al. J Physiol. .

Abstract

Key points: The extent of myosin regulatory light chain phosphorylation (RLC) necessary for smooth muscle contraction depends on the respective activities of Ca(2+) /calmodulin-dependent myosin light chain kinase and myosin light chain phosphatase (MLCP), which contains a regulatory subunit MYPT1 bound to the phosphatase catalytic subunit and myosin. MYPT1 showed significant constitutive T696 and T853 phosphorylation, which is predicted to inhibit MLCP activity in isolated ileal smooth muscle tissues, with additional phosphorylation upon pharmacological treatment with the muscarinic agonist carbachol. Electrical field stimulation (EFS), which releases ACh from nerves, increased force and RLC phosphorylation but not MYPT1 T696 or T853 phosphorylation. The conditional knockout of MYPT1 or the knockin mutation T853A in mice had no effect on the frequency-maximal force responses to EFS in isolated ileal tissues. Physiological RLC phosphorylation and force development in ileal smooth muscle depend on myosin light chain kinase and MLCP activities without changes in constitutive MYPT1 phosphorylation.

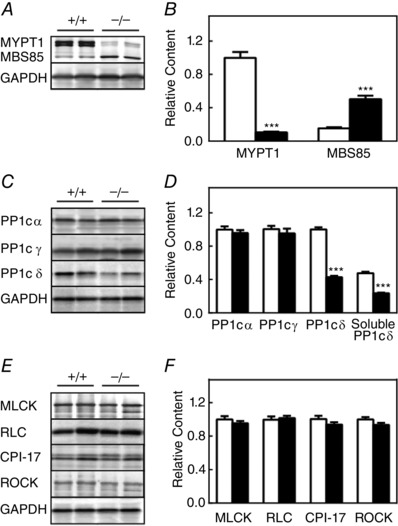
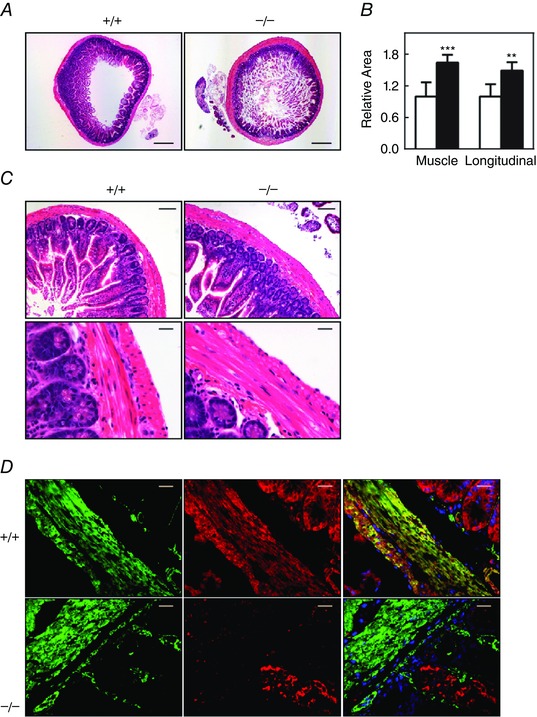
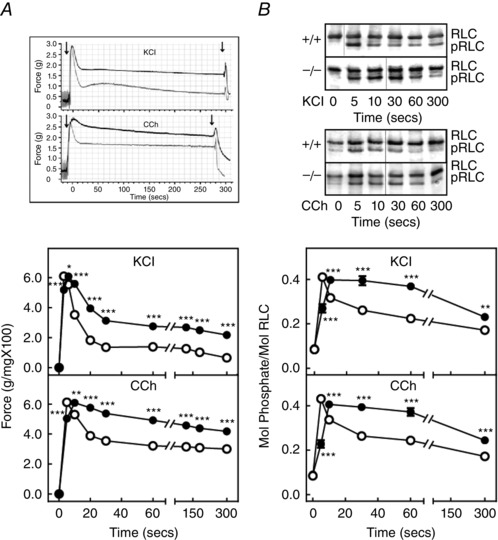
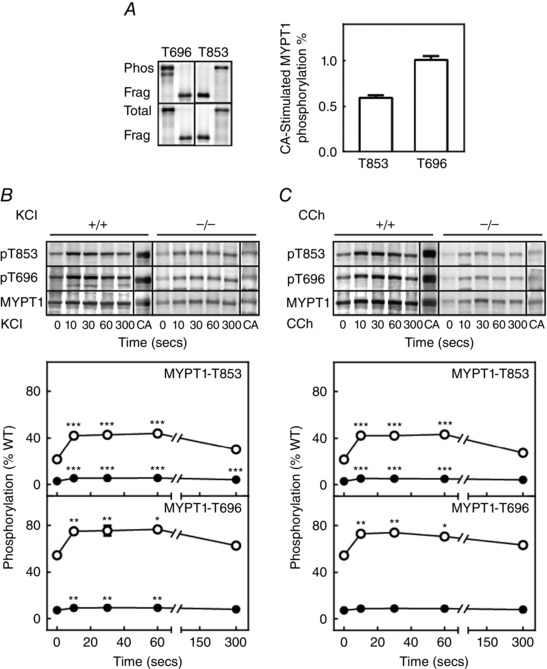
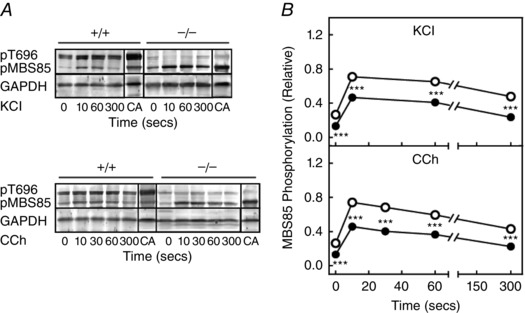
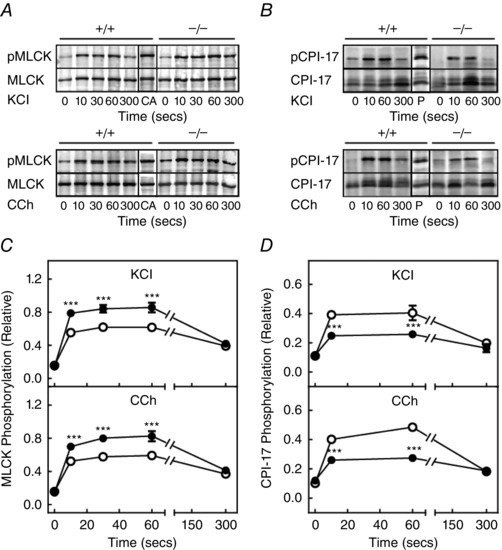
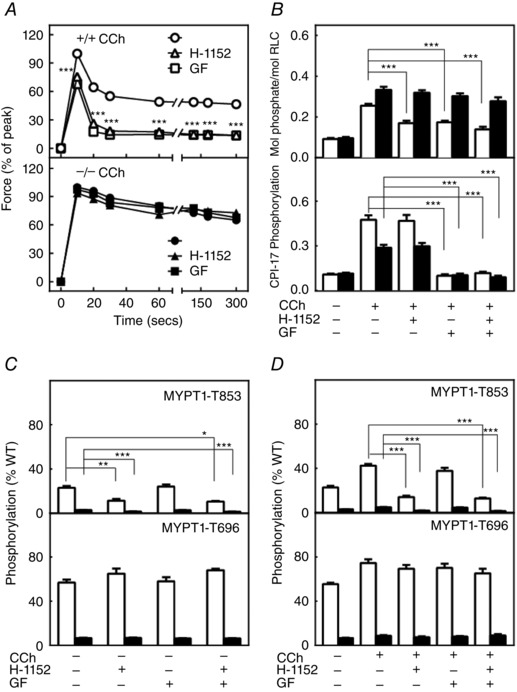
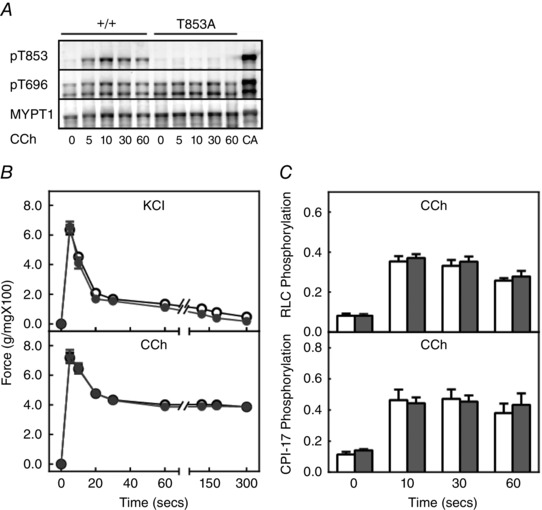
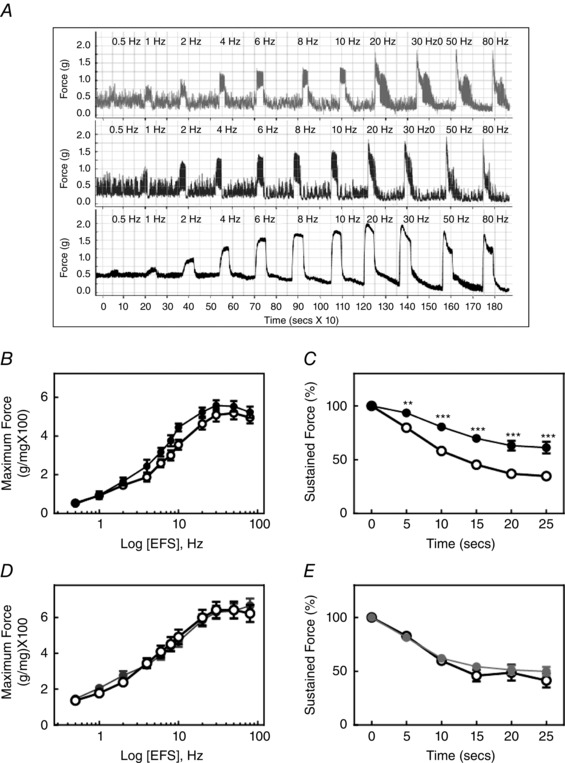
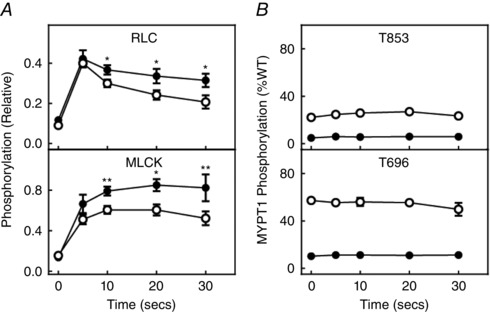
Abstract: Smooth muscle contraction initiated by myosin regulatory light chain (RLC) phosphorylation is dependent on the relative activities of Ca(2+) /calmodulin-dependent myosin light chain kinase (MLCK) and myosin light chain phosphatase (MLCP). We have investigated the physiological role of the MLCP regulatory subunit MYPT1 in ileal smooth muscle in adult mice with (1) smooth muscle-specific deletion of MYPT1; (2) non-phosphorylatable MYPT1 containing a T853A knockin mutation; and (3) measurements of force and protein phosphorylation responses to cholinergic neurostimulation initiated by electric field stimulation. Isolated MYPT1-deficient tissues from MYPT1(SM-/-) mice contracted and relaxed rapidly with moderate differences in sustained responses to KCl and carbachol treatments and washouts, respectively. Similarly, measurements of regulatory proteins responsible for RLC phosphorylation during contractions also revealed moderate changes. There were no differences in contractile or RLC phosphorylation responses to carbachol between tissues from normal mice vs. MYPT1 T853A knockin mice. Quantitatively, there was substantial MYPT1 T696 and T853 phosphorylation in wild-type tissues under resting conditions, predicting a high extent of MLCP phosphatase inhibition. Reduced PP1cδ activity in MYPT1-deficient tissues may be similar to attenuated MLCP activity in wild-type tissues resulting from constitutively phosphorylated MYPT1. Electric field stimulation increased RLC phosphorylation and force development in tissues from wild-type mice without an increase in MYPT1 phosphorylation. Thus, physiological RLC phosphorylation and force development in ileal smooth muscle appear to be dependent on MLCK and MLCP activities without changes in constitutive MYPT1 phosphorylation.


Figures

Figure 1
Figure 1. Effect of conditional MYPT1 gene ablation on content of myosin regulatory proteins in ileal tissues
The relative contents of proteins were measured by immunoblotting extracts of ileal smooth muscle tissues from MYPT1SM+/+ and MYPT1SM–/– mice. Representative immunoblots (A, C and E) and quantified results (B, D and F) are shown for MYPT1, MBS85 and PP1C (α, γ,δ), as well as RLC, MLCK, CPI‐17 and ROCK1 for ileal tissues from MYPT1SM+/+ (open bars) and MYPT1SM‐/‐ (solid bars) mice with GAPDH as a loading control. MLCP component proteins MYPT1 and MBS85 were normalized to the MYPT1 content in ileal tissues from MYPT1SM+/+ mice. MYPT1 and PP1cδ contents were similar in ileal tissues with or without mucosa in both MYPT1SM+/+ and MYPT1SM–/– mice (data not shown). Data are presented as the mean ± SEM from ≥10 animals in each group. ***P < 0.001 compared to MYPT1SM+/+.
Figure 2
Figure 2. Histological examination of ileal tissues from MYPT1SM+/+ and MYPT1SM–/– mice
A, H&E stained transverse sections of ileum revealed wall thickening in MYPT1SM−/− mice (right). Scale bars = 400 μm. B, quantified results for total and longitudinal muscle areas are presented as the mean ± SEM (n ≥ 4 mice in each group). **P < 0.01 and ***P < 0.001 compared to MYPT1SM+/+ mice. C, normal histological structure of ileum from MYPT1SM–/– mice with H&E staining. Scale bars = 100 μm (top) and 20 μm (bottom). D, immunofluorescence staining of MYPT1 in ileal smooth muscle tissue from MYPT1SM+/+ and MYPT1SM–/– mice. Green, smooth muscle α‐actin; red, anti‐MYPT1. Scale bars = 20 μm.
Figure 3
Figure 3. MYPT1‐deficient ileum exhibits increased force and RLC phosphorylation during the sustained phase of contraction
A, representative force tracings (above) of MYPT1SM+/+ (grey trace) and MYPT1SM–/− (black trace) and quantified force responses (below) for ileal strips from MYPT1SM+/+ (open circles) and MYPT1SM–/− (solid circles) mice are shown for 90 mm KCl (top) or 6 μm carbachol (CCh) (bottom) treatments. Data are the mean ± SEM (n ≥ 20). *P < 0.05 and ***P < 0.001 compared to MYPT1SM+/+ mice for the same time. The SEM bars are smaller than the symbols. B, representative immunoblots (above) following glycerol/urea‐PAGE for RLC phosphorylation and quantified RLC phosphorylation (below) responses are shown for 90 mm KCl (top) and 6 μm carbachol (CCh) (bottom) with symbols as in (A). RLC, non‐phosphorylated, pRLC, monophosphorylated. Data are the mean ± SEM from n ≥ 10 measurements each. **P < 0.01 and ***P < 0.001 compared to MYPT1SM+/+ at the same time. The SEM bars may be smaller than the symbols for the means.
Figure 4
Figure 4. Treatment with KCl or carbachol increase phosphorylation of constitutive phosphorylated MYPT1 in ileal tissues from MYPT1SM /− and MYPT1SM+/+ mice
A, quantification of MYPT1 phosphorylation in calyculin A (CA)‐treated ileum strips. Left: representative blots for calyculin A‐treated ileal strips from wild‐type mice and diphosphorylated GST‐MYPT1 fragment are shown for total MYPT1 (bottom), phosphorylated T696 and phosphorylated T853 (top). Purified GST‐ MYPT1 (654‐880) was maximally phosphorylated by ROCK1 in vitro. Right: amounts of calyculin A‐treated tissue MYPT1 phosphorylated at T696 per total T696 and MYPT1 phosphorylated at T853 per total T853 are shown as ratios. B and C, representative MYPT1 immunoblots (top) and quantitative phosphorylation results (bottom) are shown for the response to 90 mm KCl (B) and 6 μm carbachol (CCh) (C) in ileal tissues from MYPT1SM+/+ (open circles) and MYPT1SM–/– (solid circles) mice normalized to the amount of MYPT1 protein in tissues from wild‐type mice. More protein was applied to SDS‐PAGE for tissues from MYPT1SM–/− mice. MYPT1 phosphorylation was calculated relative to values obtained with calyculin A as described in (A). Data are presented as the mean ± SEM (n ≥10 animals in each group). There were no differences in the relative phosphorylation responses for MYPT1 in tissues from MYPT1SM+/+ and MYPT1SM–/– mice. *P < 0.05, **P < 0.01 and ***P < 0.001 compared to values at 0 s. The SEM bars may be smaller than the symbols for the means.
Figure 5
Figure 5. MBS85 phosphorylation responses to KCl and CCh are enhanced in ileal tissues from MYPT1‐deficient mice
Representative blots for MBS85 phosphorylation (A) and quantification of MBS85 phosphorylation (B) in response to 90 mm KCl and 6 μm carbachol (CCh) in ileal tissues from MYPT1SM+/+ (open circles) and MYPT1SM–/− (solid circles) mice. MYPT1 T696 (pT696) and MBS85 T560 (pMBS85) phosphorylation are shown in the upper panel with both normalized to that obtained with calyculin A (CA), respectively, in MYPT1SM+/+ and MYPT1SM–/− ileal tissue with GAPDH as a loading control. Values are the mean ± SEM (n ≥ 8). **P < 0.0.01 and ***P < 0.001 compared to MYPT1SM+/+ strips at the same time. The SEM bars may be smaller than the symbols for the means.
Figure 6
Figure 6. MLCK and CPI‐17 are phosphorylated in MYPT1‐deficient ileal tissues
A, representative blots for MLCK phosphorylation and (C) its quantification are shown in response to 90 mm KCl (top) and 6 μm carbachol (CCh) (bottom) in ileal tissues from MYPT1SM+/+ (open circles) and MYPT1SM–/− (solid circles) mice. MLCK phosphorylation was normalized to the response obtained with calyculin A (CA) with GAPDH as a loading control. Values are the mean ± SEM (n ≥ 10). ***P < 0.001 compared to MYPT1SM+/+ strips at the same time. B, representative blots for CPI‐17 phosphorylation and (D) its quantification are shown in response to 90 mm KCl (top) and 6 μm CCh (bottom) ileum tissues from MYPT1SM+/+ (open circle) and MYPT1SM–/− (solid circle) mice. CPI‐17 phosphorylation normalized to the response obtained with PDBu. Values are the mean ± SEM (n ≥ 10). ***P < 0.001 compared to MYPT1SM+/+ strips at the same time. The SEM bars may be smaller than the circles for the means.
Figure 7
Figure 7. ROCK and PKC inhibitors affect force as well as RLC and CPI‐17 phosphorylation responses differently in ileal tissues from MYPT1SM+/+ and MYPT1SM /− mice
A, carbachol (CCh)‐induced force development responses are shown in the absence (circles) or presence of ROCK inhibitor H‐1152 (triangles) or PKC inhibitor GF109203X (squares) in ileal tissues from MYPT1SM+/+ (+/+, top) or MYPT1SM−/− (–/–, bottom) mice. Force values are expressed relative to the peak forces in the absence of inhibitors. Data are the mean ± SEM (n ≥ 10 measurements from different animals). ***P < 0.001 compared to no treatment. The SEM bars may be smaller than the circles for the means. B, CCh‐induced RLC (top) and CPI‐17 (bottom) phosphorylation at 30 s are shown following H‐1152 or GF109203X in ileal tissues from MYPT1SM+/+ (open bars) or MYPT1SM–/− (solid bars) mice. CPI‐17 phosphorylation was quantified relative to the results obtained with PDBu. Data are presented as the mean ± SEM (n ≥ 6 animals in each group). ***P < 0.001 compared to CCh responses at 30 s. C, resting and CCh‐induced (D) phosphorylation of MYPT1 T853 (upper) and T696 (lower) were analysed following ROCK H‐1152 and PKC GF109203X inhibitor treatments, respectively, for ileal tissues from MYPT1SM+/+ (open bars) and MYPT1SM–/− (solid bars) mice. MYPT1 phosphorylation was quantified relative to the results obtained with calyculin A as shown in Fig. 4 A and normalized to the amount of MYPT1 protein of wild‐type mice. Data are presented as the mean ± SEM (n ≥10 animals in each group). *P < 0.05 and ***P < 0.001 compared to resting values (C) or CCh simulation at 30 s (D) in the absence of inhibitors.
Figure 8
Figure 8. The knockin mutation MYPT1 T853A has no effect on force development and RLC phosphorylation in ileal tissues from MYPT1T853A knockin mice
A, representative blots for MYPT1 phosphorylation in response to 6 μm carbachol (CCh) showing no MYPT1 T853 phosphorylation in tissues from homozygous MYPT1T853A knockin mice. B, force development responses in ileal strips from MYPT1SM+/+ (open circles) and MYPT1T853A (grey circles) are shown for 90 mm KCl (top) or 6 μm carbachol (CCh) (bottom) treatments. Data are the mean ± SEM (n ≥ 20). The SEM bars may be smaller than the symbols for the means. C, quantified RLC (top) and CPI‐17 phosphorylation (bottom) responses are shown for ileal strips from MYPT1SM+/+ (open bars) and MYPT1T853A (grey bars) mice to treatment with 6 μm CCh. CPI‐17 phosphorylation normalized to the response obtained with PDBu. Data are the mean ± SEM (n ≥10 animals).
Figure 9
Figure 9. Contractile responses to EFS in MYPT1‐deficient ileum
A, representative force responses are shown for indicated EFS frequencies for ileal tissues from MYPT1SM+/+ (upper trace), MYPT1T853A (middle trace) and MYPT1SM–/− (lower trace) mice. B, quantified maximum force‐frequency responses are shown for ileum from MYPT1SM+/+ (open circles) and MYPT1SM–/− (solid circles) mice. C, quantified forces following maximal responses with continuous 30 Hz EFS in ileal strips from MYPT1SM+/+ (open circles) and MYPT1SM–/− (solid circles) mice. D, quantified maximum force‐frequency responses in ileal strips from MYPT1SM+/+ (open circles) and MYPT1T853A (solid circles) mice. E, quantified forces following maximal responses with continuous 30 Hz EFS in ileal strips from MYPT1SM+/+ (open circles) and MYPT1T853A (solid circles) mice. Force measurements were normalized to the maximal developed forces marked as 0 s in (C) and (E). Data are the mean ± SEM (n ≥12 animals). **P < 0.01 and ***P < 0.001 compared to MYPT1SM+/+ at the same time. The SEM bars may be smaller than the symbols for the means.
Figure 10
Figure 10. MYPT1 T853 and T696 are not phosphorylated in response to EFS in ileal tissues from MYPT1SM+/+ or MYPT1SM /− mice
A, RLC and MLCK phosphorylation responses to 30 Hz EFS. B, MYPT1 T853 and T696 phosphorylation responses to 30 Hz EFS. Ileal tissues were from MYPT1SM+/+ (open circles) and MYPT1SM–/− (solid circles) mice. Data are the mean ± SEM (n ≥ 4 from different ileum). **P < 0.0.01 compared to MYPT1SM+/+ at the same time. All RLC and MLCK phosphorylation values were significantly greater than the values under resting conditions. Phosphorylation values for MYPT1 T696 or T853 were not significantly changed with EFS. The SEM bars may be smaller than the symbols for the means.

Similar articles

Cited by

References

    1. Bhetwal BP, Sanders KM, An C, Trappanese DM, Moreland RS & Perrino BA (2013). Ca2+ sensitization pathways accessed by cholinergic neurotransmission in the murine gastric fundus. J Physiol 591, 2971–2986. - PMC - PubMed
    1. Chen CP, Chen X, Qiao YN, Wang P, He WQ, Zhang CH, Zhao W, Gao YQ, Chen C, Tao T, Sun J, Wang Y, Gao N, Kamm KE, Stull JT & Zhu MS (2015). In vivo roles for myosin phosphatase targeting subunit‐1 phosphorylation sites T694 and T852 in bladder smooth muscle contraction. J Physiol 593, 681–700. - PMC - PubMed
    1. Cole WC & Welsh DG (2011). Role of myosin light chain kinase and myosin light chain phosphatase in the resistance arterial myogenic response to intravascular pressure. Arch Biochem Biophys 510, 160–173. - PubMed
    1. Dimopoulos GJ, Semba S, Kitazawa K, Eto M & Kitazawa T (2007). Ca2+‐dependent rapid Ca2+ sensitization of contraction in arterial smooth muscle. Circ Res 100, 121–129. - PMC - PubMed
    1. Ding HL, Ryder JW, Stull JT & Kamm KE (2009). Signalling processes for initiating smooth muscle contraction upon neural stimulation. J Biol Chem 284, 15541–15548. - PMC - PubMed

MeSH terms

LinkOut - more resources