

Global mismatch between greenhouse gas emissions and the burden of climate change
- PMID: 26848052
- PMCID: PMC4742864
- DOI: 10.1038/srep20281
Global mismatch between greenhouse gas emissions and the burden of climate change
Abstract
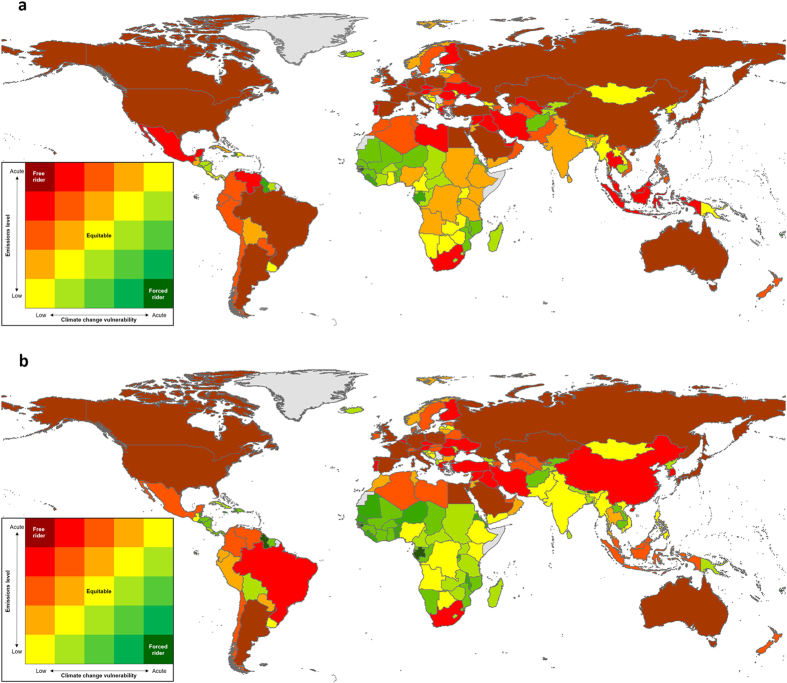
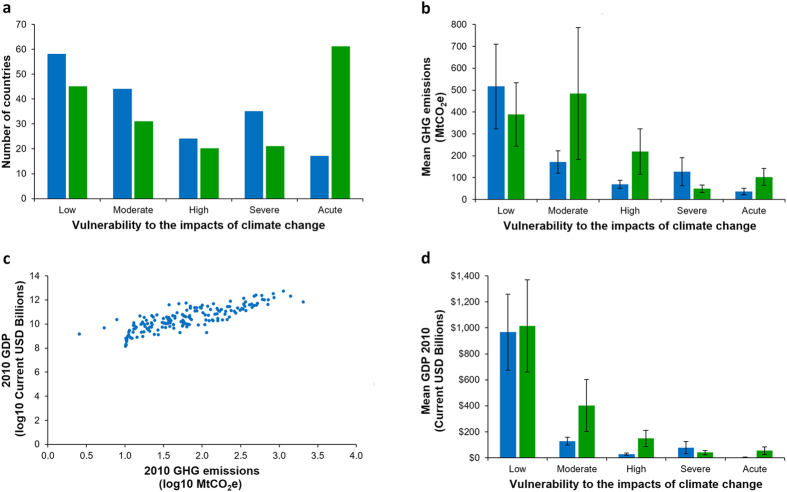
Countries export much of the harm created by their greenhouse gas (GHG) emissions because the Earth's atmosphere intermixes globally. Yet, the extent to which this leads to inequity between GHG emitters and those impacted by the resulting climate change depends on the distribution of climate vulnerability. Here, we determine empirically the relationship between countries' GHG emissions and their vulnerability to negative effects of climate change. In line with the results of other studies, we find an enormous global inequality where 20 of the 36 highest emitting countries are among the least vulnerable to negative impacts of future climate change. Conversely, 11 of the 17 countries with low or moderate GHG emissions, are acutely vulnerable to negative impacts of climate change. In 2010, only 28 (16%) countries had an equitable balance between emissions and vulnerability. Moreover, future emissions scenarios show that this inequality will significantly worsen by 2030. Many countries are manifestly free riders causing others to bear a climate change burden, which acts as a disincentive for them to mitigate their emissions. It is time that this persistent and worsening climate inequity is resolved, and for the largest emitting countries to act on their commitment of common but differentiated responsibilities.
Figures
References
-
- Ipcc. Climate Change 2014: Impacts, Adaptation, and Vulnerability. Part A: Global and Sectoral Aspects. Contribution of Working Group II to the Fifth Assessment Report of the Intergovernmental Panel on Climate Change [ Field C. B., Barros V. R., Dokken D. J., Mach K. J., Mastrandrea M. D., Bilir T. E., Chatterjee M., Ebi K. L., Estrada Y. O., Genova R. C., Girma B., Kissel E. S., Levy A. N., MacCracken S., Mastrandrea P. R., and White L. L. (eds.)]. (Cambridge University Press, 2014).
-
- Ipcc. Climate Change 2014: Impacts, Adaptation, and Vulnerability. Part B: Regional Aspects. Contribution of Working Group II to the Fifth Assessment Report of the Intergovernmental Panel on Climate Change [ Barros V. R., Field C. B., Dokken D. J., Mastrandrea M. D., Mach K. J., Bilir T. E., Chatterjee M., Ebi K. L., Estrada Y. O., Genova R. C., Girma B., Kissel E. S., Levy A. N., MacCracken S., Mastrandrea P. R. & White L. L. (eds.)]. (Cambridge University Press, 2014).
-
- United Nations Framework Convention on Climate Change. Text of the Convention. (United Nations Framework Convention on Climate Change, 1992).
-
- Jorgenson A. K. Economic development and the carbon intensity of human well-being. Nature Clim. Change 4, 186–189 (2014).
-
- Sheehan P., Cheng E., English A. & Sun F. China’s response to the air pollution shock. Nature Clim. Change 4, 306–309 (2014).
LinkOut - more resources
Full Text Sources
Other Literature Sources
