. 2016 Feb 5:6:20398.
doi: 10.1038/srep20398.

Maternal transcription of non-protein coding RNAs from the PWS-critical region rescues growth retardation in mice

Affiliations

Maternal transcription of non-protein coding RNAs from the PWS-critical region rescues growth retardation in mice

Timofey S Rozhdestvensky et al. Sci Rep. .

Abstract

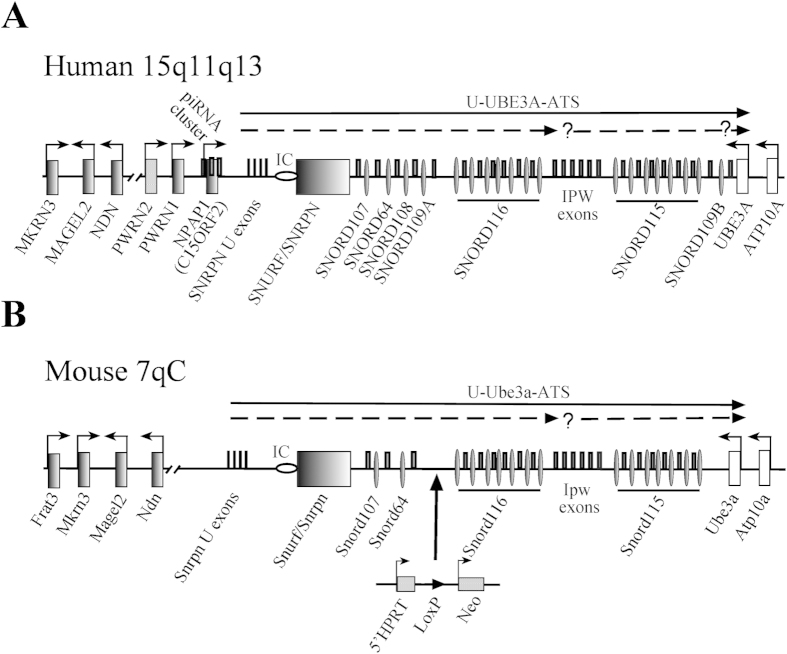
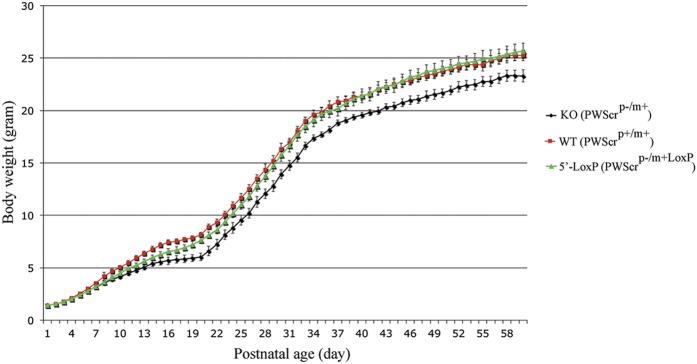
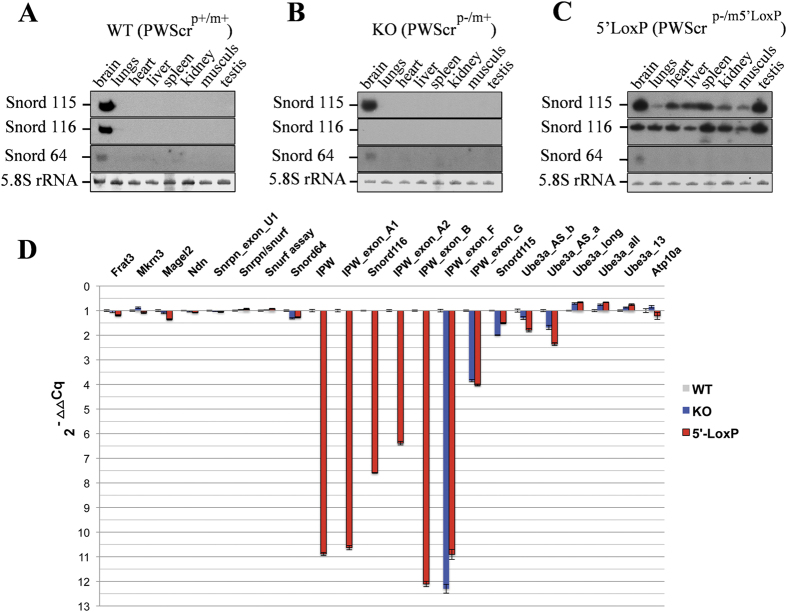
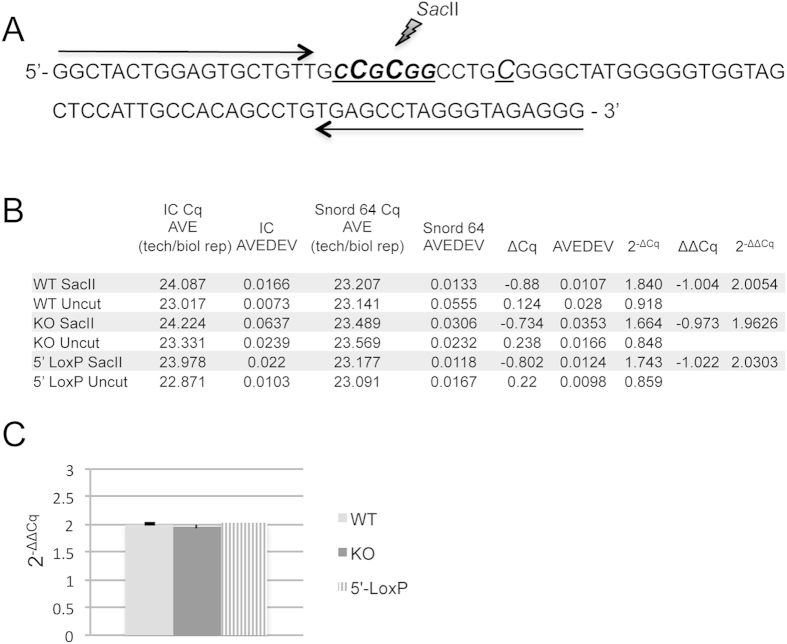
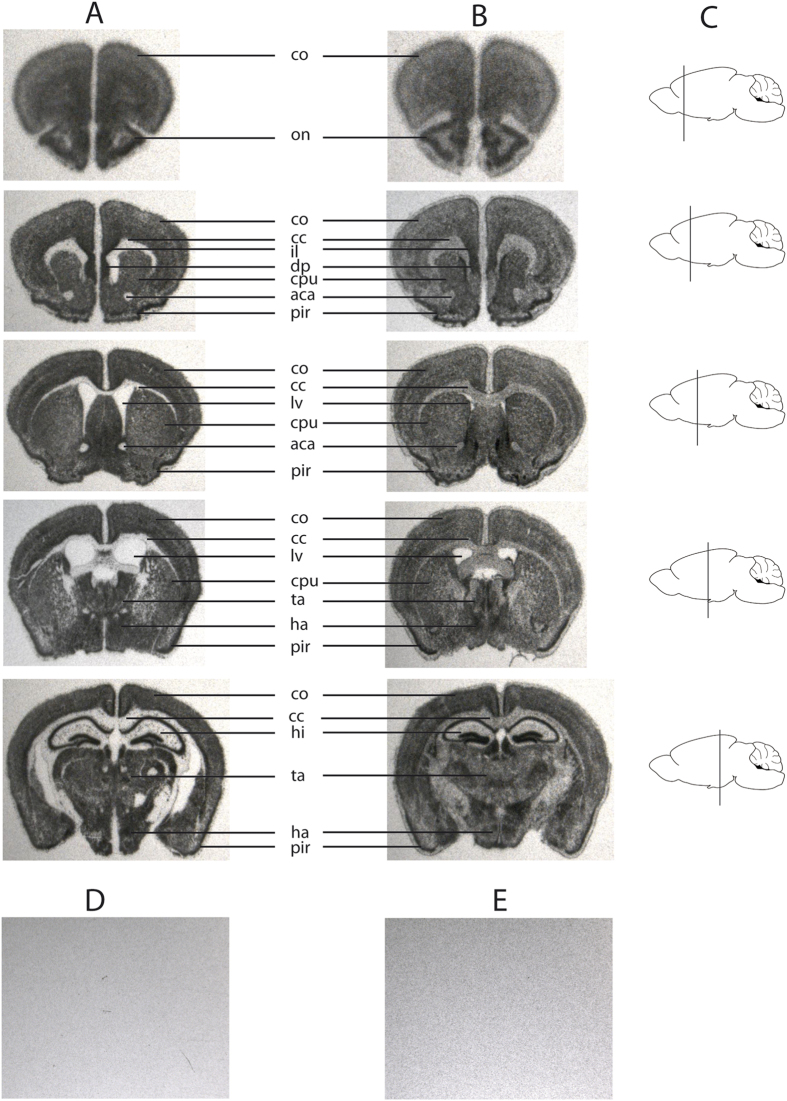
Prader-Willi syndrome (PWS) is a neurogenetic disorder caused by loss of paternally expressed genes on chromosome 15q11-q13. The PWS-critical region (PWScr) contains an array of non-protein coding IPW-A exons hosting intronic SNORD116 snoRNA genes. Deletion of PWScr is associated with PWS in humans and growth retardation in mice exhibiting ~15% postnatal lethality in C57BL/6 background. Here we analysed a knock-in mouse containing a 5'HPRT-LoxP-Neo(R) cassette (5'LoxP) inserted upstream of the PWScr. When the insertion was inherited maternally in a paternal PWScr-deletion mouse model (PWScr(p-/m5'LoxP)), we observed compensation of growth retardation and postnatal lethality. Genomic methylation pattern and expression of protein-coding genes remained unaltered at the PWS-locus of PWScr(p-/m5'LoxP) mice. Interestingly, ubiquitous Snord116 and IPW-A exon transcription from the originally silent maternal chromosome was detected. In situ hybridization indicated that PWScr(p-/m5'LoxP) mice expressed Snord116 in brain areas similar to wild type animals. Our results suggest that the lack of PWScr RNA expression in certain brain areas could be a primary cause of the growth retardation phenotype in mice. We propose that activation of disease-associated genes on imprinted regions could lead to general therapeutic strategies in associated diseases.


Figures

Figure 1
Figure 1. Schematic representation of the PWS-locus in human and mice.
(A) Human chromosome 15q11-q13 region (not drawn to scale). Rectangles or thin ovals denote protein coding gene or snoRNA gene locations and the imprinting center (IC) is shown by a horizontal oval; thin rectangles above the midline denote non-protein coding exons. Arrows indicate promoters and the direction of transcription. The two broken arrows under the top arrow showing the U-UBE3A antisense transcript harboring the two SNORD116 and SNORD115 clusters indicate putative additional primary transcripts with a possible additional promoter upstream from the SNORD115 cluster. (B) Schematic representation of the mouse PWS-locus on chromosome 7; the 5′HPRT-LoxP-NeoR targeting cassette is indicated (not drawn to scale).
Figure 2
Figure 2. Growth dynamics of PWScrp−/m5LoxP, PWScrp−/m+ and male wild type mice.
Curves show the growth dynamics of 86 male mice. The red line shows the weight gain of 30 wild type mice; the green line corresponds to 30 PWScrp−/m5LoxP mice and the black line corresponds to 26 PWScrp−/m+ mice. Bars indicate standard deviation. Weight mean, observed standard deviation, and confidence interval for each time point of the investigated mice, are calculated with a confidence level of 95% (p = 0.05) in Supplementary Table 1.
Figure 3
Figure 3. Expression of PWS/AS locus genes in PWScrp−/m5LoxP, PWScrp−/m+ and wild type mice.
(AC) Northern blot analyses of PWS-locus snoRNAs from different tissues of wild type, PWScrp−/m+ and PWScrp−/m5LoxP mice. Ethidium bromide-stained 5.8 S rRNA is shown as RNA loading control. Tissues and mouse genotypes are indicated on the top of each blot panel. (D) RT-qPCR analysis of PWS/AS-locus genes; the fold change is represented as 2−ΔΔCq. Blue and red bars represent the RNAs expression fold change values of PWScrp−/m+ and PWScrp−/m5LoxP mice, respectively. The plot represents values of Supplementary Table 2.
Figure 4
Figure 4. PWS-IC-center CpG methylation analysis.
(A) The mouse PWS-IC genomic region selected for the qPCR assay; cytosine residues that are methylated on the maternal chromosome are shown as capitalized, underlined and italic letters. The SacII endonuclease recognition site is CCGCGG. Quantitative PCR primers are indicated by a black arrows. (B) A summary of the qPCR data is detailed in Supplementary Table 4. For each mouse genotype (WT: wild type; KO: PWScrp−/m+ and 5′ LoxP: PWScrp−/m5LoxP), six brains were used to isolate DNA samples. Each sample was analysed in triplicate. DNA samples either digested and untreated are indicated by SacII and Uncut respectively. Columns: IC Cq AVE (tech/biol rep) is the average of Cq values obtained from technical and biological replicates per category during the qPCR of the PWS-IC region; IC AVEDEV is the average of standard deviations obtained from all replicates per category during qPCR of the PWS-IC region; Snord64 Cq AVE (tech/biol rep): the average of Cq values obtained during qPCR of the Snord64 gene region; Snord64 AVEDEV: is the respective average standard deviation. (C) Chart visualising 2−ΔΔCq values obtained by qPCR show no differences in CpG methylation of the PWS-IC region among the different mouse genotypes.
Figure 5
Figure 5. Snord116 in situ hybridization (ISH) of wild type and PWScrp−/m+5LoxP mouse sagittal brain sections
(A) Brain sections of wild type mice, the exposure time was one day (B) brain sections of PWScrp−/m+5LoxP mice. ISH is performed with Snord116 antisense probe. (A,B) Mouse brain arias are denoted as follows: cc: corpus callosum; co: cortex; ha: hypothalamic area; hi: hippocampus; lv: lateral ventricle; on: olfactory nucleus; pu: putamen; ta: thalamic area; pir: piriformal cortex; il: infralimbic cortex; dp: dorsal peduncular cortex. Due to the lower expression levels of Snord116 in the KI mouse, the exposure time had to be increased from 1 to 7 days. (C) Schematic representation of the cuts in sagittal brain sections. (D) Negative control, example of brain sections of PWScrp−/m+ mice hybridized with Snord116 antisense probe. (E) Example of brain sections of wild type mice hybridized with Snord116 sense probe. (D,E) The exposure time was 4 days.

Similar articles

Cited by

References

    1. Horsthemke B. & Buiting K. Genomic imprinting and imprinting defects in humans. Adv Genet 61, 225–246, doi: 10.1016/S0065-2660(07)00008-9 (2008). - DOI - PubMed
    1. Butler M. G. Prader-Willi Syndrome: Obesity due to Genomic Imprinting. Curr Genomics 12, 204–215, doi: 10.2174/138920211795677877 (2011). - DOI - PMC - PubMed
    1. Cassidy S. B., Schwartz S., Miller J. L. & Driscoll D. J. Prader-Willi syndrome. Genet Med 14, 10–26, doi: 10.1038/gim.0b013e31822bead0 (2012). - DOI - PubMed
    1. Buiting K. Prader-Willi syndrome and Angelman syndrome. Am J Med Genet C Semin Med Genet 154C, 365–376, doi: 10.1002/ajmg.c.30273 (2010). - DOI - PubMed
    1. Runte M. et al. The IC-SNURF-SNRPN transcript serves as a host for multiple small nucleolar RNA species and as an antisense RNA for UBE3A. Hum Mol Genet 10, 2687–2700 (2001). - PubMed

Publication types

MeSH terms