. 2016 Apr;37(4):1486-511.
doi: 10.1002/hbm.23115. Epub 2016 Feb 5.

Non-parametric combination and related permutation tests for neuroimaging

Affiliations

Non-parametric combination and related permutation tests for neuroimaging

Anderson M Winkler et al. Hum Brain Mapp. 2016 Apr.

Abstract

In this work, we show how permutation methods can be applied to combination analyses such as those that include multiple imaging modalities, multiple data acquisitions of the same modality, or simply multiple hypotheses on the same data. Using the well-known definition of union-intersection tests and closed testing procedures, we use synchronized permutations to correct for such multiplicity of tests, allowing flexibility to integrate imaging data with different spatial resolutions, surface and/or volume-based representations of the brain, including non-imaging data. For the problem of joint inference, we propose and evaluate a modification of the recently introduced non-parametric combination (NPC) methodology, such that instead of a two-phase algorithm and large data storage requirements, the inference can be performed in a single phase, with reasonable computational demands. The method compares favorably to classical multivariate tests (such as MANCOVA), even when the latter is assessed using permutations. We also evaluate, in the context of permutation tests, various combining methods that have been proposed in the past decades, and identify those that provide the best control over error rate and power across a range of situations. We show that one of these, the method of Tippett, provides a link between correction for the multiplicity of tests and their combination. Finally, we discuss how the correction can solve certain problems of multiple comparisons in one-way ANOVA designs, and how the combination is distinguished from conjunctions, even though both can be assessed using permutation tests. We also provide a common algorithm that accommodates combination and correction.

Keywords: conjunctions; general linear model; multiple testing; non-parametric combination; permutation tests.


Figures

Figure 1
Figure 1
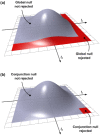
(a) Rejection region of a union–intersection test (uit) based on two independent t‐tests. The null is rejected if either of the partial tests has a statistic that is large enough to be qualified as significant. (b) Rejection region of an intersection–union test (iut) based the same tests. The null is rejected if both the partial tests have a statistic is large enough to be qualified as significant. [Color figure can be viewed in the online issue, which is available at http://wileyonlinelibrary.com.]
Figure 2
Figure 2
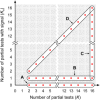
The original npc algorithm combines non‐parametric p‐values and, for imaging applications, requires substantial amount of data storage space. Two modifications simplify the procedures: (1) the statistic tk for each partial test k is transformed into a related quantity u k that has a behavior similar to the p‐values, and (2) the combined statistic is transformed to a variable that follows approximately a normal distribution, so that spatial statistics (such as cluster extent, cluster mass, and tfce) can be computed as usual. The first simplification allows the procedure to run in a single phase, without the need to retrieve data for the empirical distribution of the partial tests. [Color figure can be viewed in the online issue, which is available at http://wileyonlinelibrary.com.]
Figure 3
Figure 3
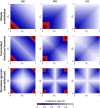
Upper row: Rejection regions for the combination of two partial tests using four different combining functions, and with the p‐values assessed parametrically (Table I). The regions are shown as function of the p‐values of the partial tests (pk). Middle row: Rejection regions for the same functions with the modification to favor alternative hypotheses with concordant directions. Lower row: Rejection regions for the same functions with the modification to ignore the direction altogether, that is, for two‐tailed partial tests. [Color figure can be viewed in the online issue, which is available at http://wileyonlinelibrary.com.]
Figure 4
Figure 4
The simulations ad. Each was constructed with a set of K partial tests, a number of which (Ks) had synthetic signal added. [Color figure can be viewed in the online issue, which is available at http://wileyonlinelibrary.com.]
Figure 5
Figure 5
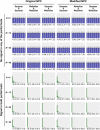
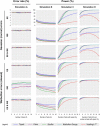
Histograms of frequency of p‐values for the simulation without signal in either of the two partial tests (upper panel, blue bars) or with signal in both (lower panel, green bars). The values below each plot indicate the height (in percentage) of the first bar, which corresponds to p‐values smaller than or equal to 0.05, along with the confidence interval (95%, italic). Both original and modified npc methods controlled the error rates at the nominal level, and produced flat histograms in the absence of signal. The histograms suggest similar power for both approaches. See also the Supporting Information. [Color figure can be viewed in the online issue, which is available at http://wileyonlinelibrary.com.]
Figure 6
Figure 6
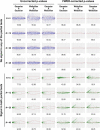
Bland–Altman plots comparing the original and modified npc, for both uncorrected and corrected p‐values, without signal in either of the two partial tests (upper panel, blue dots) or with signal in both (lower panel, green dots). The values below each plot indicate the percentage of points within the 95% confidence interval ellipsoid. For smaller sample sizes and non‐Gaussian error distributions, the methods differ, but the differences become negligible as the sample size increases. In the presence of signal, the modification caused increases in power, particularly for the corrected p‐values, with dots outside and above the ellipsoid. See the Supporting Information for zoomed in plots, in which axes tick labels are visible. [Color figure can be viewed in the online issue, which is available at http://wileyonlinelibrary.com.]
Figure 7
Figure 7
Performance of the modified npc with four representative combining functions (Tippett, Fisher, Stouffer, and Mudholkar–George) and of one cmv (Hotelling's T 2), using normal or skewed errors, and using permutations (ee), sign flippings (ise), or both. All resulted in error rates controlled at or below the level of the test. The Tippett and Fisher were generally the most powerful, with Tippett outperforming others with signal present in a small fraction of the tests, and with Fisher having the best power in the other settings. [Color figure can be viewed in the online issue, which is available at http://wileyonlinelibrary.com.]
Figure 8
Figure 8
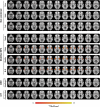
Without combination, and with correction across voxels (mtp‐i), no significant results were observed at the group level for any of the three tests. Combination using the methods of Fisher, Stouffer and Mudholkar–George (M–G), however, evidenced bilateral activity in the insula in response to hot, painful stimulation. A classical multivariate test, Hotelling's T 2, as well as the Tippett method, failed to identify these areas. An intersection‐union test (conjunction) could not locate significant results; such a test has a different null hypothesis that distinguishes it from the others. Images are in radiological orientation. For cluster‐level results, comparable to Brooks et al. [2005], see the Supporting Information. [Color figure can be viewed in the online issue, which is available at http://wileyonlinelibrary.com.]
Figure B1
Figure B1
Examples of inconsistent combining functions for testing the global null hypothesis: (a) Addition of p‐values for the partial tests [Edgington 1972]; (b) Maximum of p‐values for the partial tests, with the p‐value computed as TK [Friston et al., 2005]; (c) Maximum of p‐values for the partial tests, but with the p‐value computed as T [Nichols et al., 2005]. While the last is not appropriate for testing the global null, it is appropriate for the conjunction null. [Color figure can be viewed in the online issue, which is available at http://wileyonlinelibrary.com.]
Figure C1
Figure C1
Upper row: Inadmissible versions of the four consistent combining functions shown in Figure 3 (in the same order). Lower row: Inadmissible versions of the three inconsistent combining functions shown in Figure 9 (in the same order). These inadmissible functions arise if one attempts to favor alternatives with the same sign while performing two‐tailed partial tests. [Color figure can be viewed in the online issue, which is available at http://wileyonlinelibrary.com.]

Similar articles

Cited by

References

    1. Abou Elseoud A, Nissilä J, Liettu A, Remes J, Jokelainen J, Takala T, Aunio A, Starck T, Nikkinen J, Koponen H, Zang YF, Tervonen O, Timonen M, Kiviniemi V (2014): Altered resting‐state activity in seasonal affective disorder. Hum Brain Mapp 35:161–172. - PMC - PubMed
    1. Anderson TW (2003): An Introduction to Multivariate Statistical Analysis. Hoboken, NJ: Wiley.
    1. Benjamini Y, Hochberg Y (1995): Controlling the false discovery rate: A practical and powerful approach to multiple testing. J R Stat Soc Ser B 57:289–300.
    1. Benjamini Y, Heller R (2008): Screening for partial conjunction hypotheses. Biometrics 64:1215–1222. - PubMed
    1. Berger RL (1982): Multiparameter hypothesis testing and acceptance sampling. Technometrics 24:295–300.

Publication types

MeSH terms