Mitochondria are required for pro-ageing features of the senescent phenotype
- PMID: 26848154
- PMCID: PMC4818766
- DOI: 10.15252/embj.201592862
Mitochondria are required for pro-ageing features of the senescent phenotype
Abstract
Cell senescence is an important tumour suppressor mechanism and driver of ageing. Both functions are dependent on the development of the senescent phenotype, which involves an overproduction of pro-inflammatory and pro-oxidant signals. However, the exact mechanisms regulating these phenotypes remain poorly understood. Here, we show the critical role of mitochondria in cellular senescence. In multiple models of senescence, absence of mitochondria reduced a spectrum of senescence effectors and phenotypes while preserving ATP production via enhanced glycolysis. Global transcriptomic analysis by RNA sequencing revealed that a vast number of senescent-associated changes are dependent on mitochondria, particularly the pro-inflammatory phenotype. Mechanistically, we show that the ATM, Akt and mTORC1 phosphorylation cascade integrates signals from the DNA damage response (DDR) towards PGC-1β-dependent mitochondrial biogenesis, contributing to aROS-mediated activation of the DDR and cell cycle arrest. Finally, we demonstrate that the reduction in mitochondrial content in vivo, by either mTORC1 inhibition or PGC-1β deletion, prevents senescence in the ageing mouse liver. Our results suggest that mitochondria are a candidate target for interventions to reduce the deleterious impact of senescence in ageing tissues.
Keywords: ageing; inflammation; mTOR; mitochondria; senescence.
© 2016 The Authors. Published under the terms of the CC BY 4.0 license.
Figures
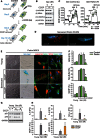
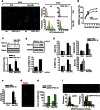
Scheme illustrating the experimental design: Parkin‐expressing and control
MRC 5 fibroblasts were irradiated with 20‐Gy X‐ray and 2 days after were treated with 12.5 μMCCCP for 48 h. At day 4 after irradiation,CCCP was removed and cells were kept in culture with normal serum‐supplemented medium. Cells were harvested at days 10 or 20 after irradiation (6 or 16 days afterCCCP treatment, respectively) for senescent phenotypes analysis.Western blots showing the absence of mitochondrial proteins from the different mitochondrial complexes:
NDUFB 8 (complex I),SDHA (complexII ),UQCRC 2 (complexIII ) andMTCO ‐1 (complexIV ), in senescent (10 days after 20‐Gy X‐ray) control and Parkin‐expressingMRC 5 fibroblasts. Data are representative of three independent experiments.Cellular oxygen consumption rates (
OCR ) in senescent (10 days after 20‐Gy X‐ray) control and Parkin‐expressingMRC 5 fibroblasts. Data were obtained using the SeahorseXF 24 analyzer and show mean ± SD n = 4 technical repeats (representative of two independent experiments).Representative 3D
EM pictures of senescent (20 days after 20‐Gy X‐ray) Parkin‐expressingMRC 5 fibroblasts with or withoutCCCP . Mitochondria are in red; the nucleus in blue.Representative images of cell size, Sen‐β‐Gal activity (blue cytoplasmic staining), macro‐H2A foci and
SDHA immunofluorescence in proliferating and senescent (10 days after 20‐Gy X‐ray) Parkin‐expressingMRC 5 fibroblasts. Scale bar = 10 μm.Quantification of
ROS levels (DHE fluorescence), Sen‐β‐Gal‐positive cells and senescence‐associated heterochromatin foci (SAHF ) observed byDAPI in proliferating and senescent (10 days after 20‐Gy X‐ray) control and Parkin‐expressingMRC 5 fibroblasts. Data are mean ± SEM of n = 3 independent experiments; asterisks denote a statistical significance at P < 0.05 using one‐wayANOVA .Representative Western blots showing p21 and p16 expression in proliferating and senescent (10 days after 20‐Gy X‐ray) control and Parkin‐expressing
MRC 5 fibroblasts. Data are representative of 3 independent experiments.Secreted protein measured in a cytokine array (RayBiotech) of a variety of inflammatory proteins in proliferating and senescent (10 days after 20‐Gy X‐ray) Parkin‐expressing
MRC 5 fibroblasts. Data are mean ± SEM of n = 3 independent experiments. Asterisks denote a statistical significance at P < 0.05 using one‐wayANOVA .
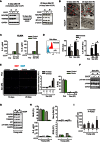
Effects of
CCCP treatment on mitochondrial depletion, immediately (left) and 16 days (right) after 48 h of 12.5 μMCCCP treatment on irradiated (IR )MRC 5 fibroblasts. Cells were irradiated with 20‐Gy X‐ray and treated with 12.5 μMCCCP at day 2 after irradiation. After 48 h ofCCCP treatment, cells were either immediately collected for analysis (4 days afterIR ) or were kept in culture with normal serum‐supplemented medium for 16 days and then harvested for analysis (20 days afterIR ). Western blots are representative of three independent experiments.T.E.M. images of senescent Parkin‐expressing
MRC 5 fibroblasts at 10 and 20 days after irradiation, pre‐treated or not withCCCP . Scale bar = 1 μm; red arrows denote mitochondria. Note: when conducting 3D‐EM of 20 days afterIR , one cell appeared to have lost Parkin and did not show the depletion of mitochondria (indistinguishable from controls), while those where depletion was complete (the majority) were devoid of intact mitochondria.Levels of secreted
IL ‐6 andIL ‐8 proteins (measured byELISA ) in proliferating and senescent (10 days after 20‐Gy X‐ray) control and Parkin‐expressingMRC 5 fibroblasts with or without 12.5 μMCCCP treatment. Data are representative of two independent experiments.(left) Representative flow cytometry histogram of mitochondrial mass staining (
NAO ) in parental and rho0 143B osteosarcoma cells (data are representative of three independent experiments), (middle) quantification ofROS levels (DHE intensity) and (right)mRNA abundance of theSASP factorIL ‐6 in parental and rho0 cells following 10‐Gy X‐ray. Data are mean ± SEM of n = 3 independent experiments; asterisks denote a significance by one‐wayANOVA at P < 0.05.Representative images of the proliferation marker Ki67 (representative of two independent experiments), quantification of population doublings (
PD ) and BrdU‐positive cells of proliferating and senescent (10 and/or 20 days after 20‐Gy X‐ray) control and Parkin‐expressingMRC 5 fibroblasts with or without 12.5 μMCCCP treatment. Data are mean ± SEM of n = 3 independent experiments forPD analysis and mean ± SD of 10 random panes for BrdU analysis.Representative Western blots of
mTORC 1 activity, measured by p70S6K phosphorylation (T389), in senescent (10 days after 20‐Gy X‐ray) control (C) and Parkin‐expressing (P)MRC 5 fibroblasts. Data are representative of 3 independent experiments.Representative Western blots showing the absence of mitochondrial proteins (
NDUFB 8,SDHA ,UQCRC 2 andTOMM 20), expression of p21 andmTOR activity (measured by phosphorylation of the p70S6K (T389)) in proliferating control and Parkin‐expressingMRC 5 fibroblasts (10 days after 48 h of 12.5 μMCCCP treatment). Data are representative of two independent experiments.Quantification of BrdU‐positive cells (data are mean ± SD of n = 2 independent experiments), Sen‐β‐Gal activity (data are mean ± SD from 10 random planes),
IL ‐6 secretion measured byELISA (data are representative of two independent experiments) andROS levels measured byDHE intensity (data are mean ± SD of n = 3 technical repeats) of proliferating control and Parkin‐expressingMRC 5 fibroblasts (after 48 h of 12.5 μMCCCP treatment).Steady‐state cellular
ATP levels were measured using anATP luciferase Kit (Invitrogen) in proliferating control and Parkin‐expressingMRC 5 fibroblasts (after 48 h of 12.5 μMCCCP treatment). Data are mean ± SEM of n = 3 independent experiments.

Column clustered heatmap showing all genes that are differentially expressed between proliferating (Prol), senescent (Sen) and mitochondria‐depleted senescent (
MDS en) Parkin‐expressingMRC 5 fibroblasts (FDR ≤ 5%, absolute fold ≥ 2). Genes are by column and samples by row. The colour intensity represents column Z‐score, where red indicates highly and blue lowly expressed.Venn diagram showing the overlap of the differentially expressed genes (
FDR ≤ 5%, absolute fold ≥ 2) between proliferating and senescent cells and between senescent andMD senescent cells. Direction of change is indicated.Table of the 10 most significantly enriched (
FDR ≤ 5%) gene ontologies for the “fully reversed” genes, as defined by the toolDAVID . Ontologies that are amongst the 10 most significantly enriched for genes that are significantly up‐regulated between proliferating and senescent cells are indicated in red.Column clustered heatmaps of all
SASP genes and cell cycle genes that are differently expressed in senescence; genes are by column and samples by row. The colour intensity represents column Z‐score, where red indicates highly and blue lowly expressed.SASP heatmap: genes that are labelled in green represent the 60% that are fully reversed and genes labelled in pink represent the 5% that became exacerbated upon mitochondria clearance. Cell cycle heatmap: genes labelled in red are significantly changed upon mitochondria clearance.
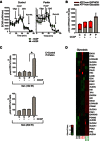
Extracellular acidification rate (
ECAR ) of senescent (10 days after 20 Gy) control and Parkin‐expressingMRC 5 fibroblasts with or without 12.5 μMCCCP treatment.ECAR was measured using a SeahorseXF 24 analyzer. Data are representative graphs from the SeahorseXF 24 analyzer software. Data are mean ± SD n = 4 technical repeats (representative of two independent experiments).ATP production rate in senescent (10 days after 20 Gy) control (C) and Parkin‐expressing (P)MRC 5 fibroblasts with or without 12.5 μMCCCP treatment (calculated from theOCR andECAR measured using a SeahorseXF 24 analyzer).ATP production by mitochondria was calculated by multiplying theATP turnover ((basalOCR ) – (OCR with oligomycin) by the established phosphorus/oxygen (P/O) ratio of 2.3 (Brand, 2005).ATP production by glycolysis is considered to have a 1:1 ratio with lactate production. The extracellular acidification rate is mainly due to lactate and bicarbonate production and, when calibrated as the proton production rate, indicates glycolytic rate (Birket et al 2011; Wu et al, 2007). Data are mean ± SD, n = 4 technical repeats (representative of two independent experiments).Steady‐state cellular
ATP levels were measured using anATP luciferase assay (Invitrogen) in senescent control and Parkin‐expressingMRC 5 fibroblasts with or without 12.5 μMCCCP treatment, at 10 days (data are mean ± SEM, n = 3 independent experiments) and 20 days (data are mean ± SD from n = 3 technical repeats) after 20‐Gy X‐ray. Asterisk denotes a statistical significance at P < 0.05 using one‐wayANOVA .Heatmap of the
RNA ‐seq analysis of glycolysis‐associated gene expression in proliferating and senescent (10 days after 20 Gy) Parkin‐expressingMRC 5 fibroblasts with or without 12.5 μMCCCP treatment. Red indicates up‐regulated genes; green indicates down‐regulated genes. Data are from n = 3 independent experiments.
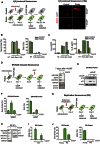
(left) Scheme showing experimental design: control and Parkin‐expressing
MRC 5 fibroblasts were induced to senescence with 400 μM of H2O2 for 1 h in serum‐free medium. Two days upon the induction of senescence with H2O2, cells were treated with 12.5 μMCCCP for 48 h and then cultured in normal serum‐supplemented medium during 6 or 16 days for senescence markers analysis (10 and 20 days following the induction of senescence, respectively); (right) Representative images of the mitochondrial proteinSDHA (immunofluorescence) in senescent control and Parkin‐expressingMRC 5 fibroblasts, 10 days after the induction of senescence with 400 μM H2O2. Scale bar = 10 μm.Quantification of Sen‐β‐Gal‐ (data are mean ± SD of n = two independent experiments) and BrdU‐positive (data are mean ± SD of 10 random planes) proliferating and senescent (10 and 20 days after the induction of senescence with 400 μM H2O2) control and Parkin‐expressing
MRC 5 fibroblasts with or without 12.5 μMCCCP treatment.Levels of secreted
IL ‐8 andIL ‐6 proteins (measured byELISA ) in proliferating and senescent (10 days after the induction of senescence with 400 μM H2O2) control and Parkin‐expressingMRC 5 fibroblasts with or without 12.5 μMCCCP treatment. Data are representative of two independent experiments.(left) Scheme showing experimental design: oncogene‐induced senescence (
OIS ) experiments were performed by treating Parkin‐expressingER ‐RAS /IMR ‐90 fibroblasts with 12.5 μMCCCP for 48 h, followed byER ‐RAS induction with 100 nM of 4‐hydroxytamoxifen (4‐OHT ). Cells were harvested 7 days afterER ‐RAS induction; (right) Representative Western blots showing the expression of the mitochondrial proteinsNDUFB 8,SDHA ,UQCRC 2 andCOXIV inOIS Parkin‐expressingER ‐RAS /IMR ‐90 fibroblasts. Data are representative of two independent experiments.Representative Western blots showing the expression of p21 and p16 proteins in
OIS Parkin‐expressingER ‐RAS /IMR ‐90 fibroblasts, 7 days afterER ‐RAS induction. Data are representative of two independent experiments.Quantification of Sen‐β‐Gal‐ and EdU‐positive proliferating and
OIS Parkin‐expressingER ‐RAS /IMR ‐90 fibroblasts, 7 days afterER ‐RAS induction. Data are mean ± SD of n = 2 independent experiments.Scheme illustrating the experimental design: Parkin‐expressing
MRC 5 fibroblasts were cultured until replicative senescence (RS ).RS cells were treated with 12.5 μMCCCP for 48 h (until day 2) and then cultured in normal serum‐supplemented medium for 6 days.Representative Western blots showing the absence of mitochondrial proteins from the different mitochondrial complexes:
NDUFB 8 (complex I),SDHA (complexII ),UQCRC 2 (complexIII ) andMTCO ‐1 (complexIV ) and expression of p21 and p16 in replicative senescent Parkin‐expressingMRC 5 fibroblasts, 6 days after 12.5 μMCCCP treatment. Data are representative of two independent experiments.ROS analysis (DHE intensity) in replicative senescent Parkin‐expressingMRC 5 fibroblasts, 6 days after 12.5 μMCCCP treatment. Data are mean ± SD of n = 3 technical repeats and are representative of two independent experiments.Quantification of Sen‐β‐Gal‐ and BrdU‐positive cells in proliferating and replicative senescent (
RS ) Parkin‐expressingMRC 5 fibroblasts, 6 days after 12.5 μMCCCP treatment. Data are mean ± SD of 10 random planes and are representative of two independent experiments.
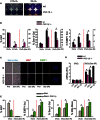
(left) Representative images and (right) histograms showing the distribution of MitoTracker green (
MTG ) immunofluorescence in proliferating and senescent (3 days after 10‐Gy X‐ray) wild‐type andPGC ‐1β −/−MEF s. Scale bar = 10 μm. Dashed red lines indicate median MitoTracker green intensity (50–100 cells were quantified per condition).Kinetics of mt
DNA copy number after 10‐Gy X‐ray in wild‐type andPGC ‐1β −/−MEF s. Data are mean ± SEM of n = 3 independent experiments.Expression of the mitochondrial outer membrane protein
VDAC in wild‐type andPGC ‐1β −/−MEF s 1 day after 10‐Gy X‐ray. Data are mean ± SEM of n = 3 independent experiments.Knockdown efficiency of
PGC ‐1β in humanMRC 5 fibroblasts infected with a control vector (shScr) and with a shPGC ‐1β vector by Western blot andqPCR .Quantification of mitochondrial mass (
NAO intensity), mitochondrialROS (MitoSOX intensity), mean number (N) of 53PB 1 foci and Edu‐positive cells in proliferating and senescentMRC 5 fibroblasts infected with a control (shScr) and shPGC ‐1β vector. Mitochondrial mass andROS measurements were performed 3 days after 20‐Gy X‐ray (data are mean ± SD of n = 3 technical replicates). 53BP 1 foci and EdU incorporation were analysed 10 days after 20‐Gy X‐ray (data are mean ± SD of 80–100 cells/condition for 53BP 1 analysis and 10 random planes for the EdU incorporation analysis).Quantification of Sen‐β‐Gal‐positive cells in proliferating and senescent (10 days after 20‐Gy X‐ray)
MRC 5 fibroblasts infected with control (shScr) and shPGC ‐1β vectors. Data are mean ± SD 10 random planes.Representative image of
FLAG ‐PGC ‐1β immunostaining 2 days following the transfection of a pcDNA empty vector and pcDNA f:PGC ‐1β in wild‐typeMEF s. Scale bar = 20 μm.mRNA expression ofPGC ‐1β in proliferating and senescent (10 days after 10‐Gy X‐ray) wild‐typeMEF s following the transfection with pcDNA empty vector and pcDNA f:PGC ‐1β. Data are mean ± SEM of n = 3 independent experiments.(top) Representative image of
FLAG ‐PGC ‐1β (red) and the mitochondrial proteinSDHA (green) double immunostaining and (bottom) histograms showing the distribution ofSDHA fluorescence, 2 days after transfection with a pcDNA empty vector and pcDNA f:PGC ‐1β in wild‐typeMEF s. Scale bar = 10 μm. Dashed red lines indicate medianSDHA fluorescence (100 cells were quantified per condition).
Representative images of colony assays of wild‐type and
PGC ‐1β −/−MEF s grown at 3 or 21% O2 (10 days after seeding 5,000 cells per well). Data are representative of 3 independent experiments.Effect of 3 or 21% O2 and X‐ray irradiation (at 3% O2) on the percentage of Ki67 (at day 6) and Sen‐β‐Gal‐positive cells (at day 10) and the number (N) of 53
BP 1 foci (at day 6) in wild‐type andPGC ‐1β −/−MEF s. Data are mean ± SEM of n = 3 independent experiments; asterisks denote a statistical significance at P < 0.05 using one‐wayANOVA .Representative images of Sen‐β‐Gal activity (blue cytoplasmatic staining), Ki‐67 and 53
BP 1 foci in proliferating and senescent wild‐type andPGC ‐1β −/−MEF s (scale bar = 10 μm).mRNA expression ofPGC ‐1β,CXCL ‐1 and p16 in proliferating and senescent (10 days after 10‐Gy X‐ray) wild‐type andPGC ‐1β −/−MEF s. Data are mean ± SEM of n = 3 independent experiments; asterisks denote a statistical significance at P < 0.05 using one‐wayANOVA .Effects of overexpression of
PGC ‐1β on percentage of Ki67‐ and Sen‐β‐Gal‐positive cells, number (N) of 53BP 1 foci and percentage change in mitochondrial mass (NAO intensity) in proliferating and senescent (2 days after 10‐Gy X‐ray)MEF s cultured at 3% O2. Data are mean ± SEM of n = 3 independent experiments. Asterisks denote a statistical significance at P < 0.05 using one‐way ANOVA or two‐tailed t‐test.
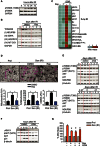
Representative Western blot of
mTORC 1 activity measured by phosphorylated p70S6K (T389) from 6 to 72 h after 20 Gy inMRC 5 fibroblasts. Data are representative of three independent experiments.Representative Western blots of the mitochondrial proteins
TOMM 20,NDUFB 8 (complex I),SDHA (complexII ),UQCR 2 (complexIII ) andMT ‐CO 1 (complexIV ) following 20‐Gy irradiation with or without 100 nM rapamycin treatment inMRC 5 fibroblasts. Data are representative of 4 independent experiments.Effect of 100 nM rapamycin on mitochondrial mass (measured by
NAO fluorescence) 2–4 days following replication exhaustion (RS ), genotoxic stress (generated by X‐ray irradiation, etoposide, neocarzinostatin (NCS ), H2O2) or telomere dysfunction (TRF 2ΔBΔM) in a variety of cell lines. Data are mean from 3 independent experiments per cell line or treatment.(top) Representative transmission electron microscopy (T.E.M.) micrographs of proliferating and senescent (3 days after 20‐Gy X‐ray)
MRC 5 fibroblasts treated with or without 100 nM rapamycin. Mitochondria are labelled in pink. Scale bar = 2 μm; (bottom left and middle) Quantification of mitochondrial volume fraction (%Vv) and mitochondrial number per cross‐section in proliferating and senescent (3 days after 20‐Gy X‐ray)MRC 5 fibroblasts treated with or without 100 nM rapamycin. T.E.M. mitochondrial analysis is mean ± SEM of 24 electron micrographs per condition; (bottom right) mtDNA copy number analysis byqPCR in proliferating and senescent (3 days after 20‐Gy X‐ray)MRC 5 fibroblasts treated with or without 100 nM rapamycin. Data are mean ± SEM of n = 3 independent experiments; asterisks denote a statistical significance at P < 0.05 using one‐wayANOVA .Representative Western blots showing the expression of phosphorylated p70S6K (T389) and
AKT (S473), the mitochondrial proteinNDUFB 8 and theDDR downstream target p21 inMRC 5 fibroblasts treated with or without 10 μM of theATM inhibitorKU 55933 and in fibroblasts from a patient with ataxia telangiectasis (AT ) at different time points after 20‐Gy X‐ray. Data are representative of three independent experiments (ATM inhibitor) and 1 experiment (AT patient).Western blots showing the effect of the
ATM inhibitorKU 55933 on γH2A.X,AKT phosphorylation and p21 expression inMRC 5 fibroblasts after 20‐Gy X‐ray. Data are from one experiment.Effect of rapamycin and/or
ATM inhibitor (KU 55933) on mitochondrial mass (NAO intensity) in proliferating and senescent (3 days after 20‐Gy X‐ray)MRC 5 fibroblasts. Data are mean ± SEM of n = 3 independent experiments. Asterisks denote a statistical significance at P < 0.05 using one‐way ANOVA.

(left) Representative images of γH2A.X (red foci) immunofluorescence in
MRC 5 fibroblasts at different time points after 20‐Gy X‐ray with or without 100 nM rapamycin supplementation (scale bar = 5 μm) and (right) representative images of 53BP 1 (green foci) immunofluorescence inMEF s, 3 days after 10‐Gy X‐ray with or without 100 nM rapamycin supplementation (scale bar = 5 μm).Effect of genomic damage‐ or oxidative stress‐induced senescence on the mean number (N) of γH2A.X foci in
MRC 5 fibroblasts with or without 100 nM rapamycin. Cells were analysed 3 days after the induction of senescence and treatment with rapamycin. Data are mean ± SEM of n = 3 independent experiments; asterisks denote a statistical significance at P < 0.05 using one‐wayANOVA .(top) Representative Western blot showing the inhibition of p21 protein expression with 100 nM rapamycin at different time points (days) after 20‐Gy X‐ray in
MRC 5 fibroblasts. Data are representative of three independent experiments; (bottom) p21mRNA levels at 3 days after 20‐Gy X‐ray with or without 100 nM rapamycin treatment inMRC 5 fibroblasts. Data are mean ± SEM of n = 3 independent experiments; asterisks denote a statistical significant at P < 0.05 using one‐wayANOVA .Western blots showing the knockdown efficiency of two different si
RNA s againstmTOR and its effects on p70S6K phosphorylation (T389), 2 days after 20‐Gy X‐ray inMRC 5 fibroblasts. Data are representative of two independent experiments.Effect of 100 nM rapamycin supplementation on Sen‐β‐Gal activity in
MRC 5 fibroblasts induced to senescence following treatment with 20‐Gy X‐ray irradiation, 80 ng ml−1 neocarzinostatin (NCS ), 50 μM etoposide, 400 μM H2O2 and replicative exhaustion (RS ). Cells were analysed 10 days after the induction of senescence and treatment with rapamycin. Data are mean ± SEM of n = 3 independent experiments (at least 80 cells were analysed per condition). Asterisks denote a statistical significance at P < 0.05 using one‐way ANOVA.Quantification of Ki67‐positive
MRC 5 fibroblasts 3 and 10 days following 20‐Gy X‐ray irradiation with or without 100 nM rapamycin treatment. Data are mean ± SEM of n = 4 independent experiments; asterisks denote a statistical significance at P < 0.05 using one‐wayANOVA .Secreted protein array of a variety of inflammatory proteins following 20‐Gy X‐ray‐induced senescence in
MRC 5 fibroblasts with or without 100 nM rapamycin treatment (3 and 10 days after 20‐Gy X‐ray). Data are mean of three independent experiments.mRNA expression ofIL ‐6 after 20‐Gy X‐ray (left) with or without 100 nM rapamycin treatment inMRC 5 fibroblasts and (right) in human fibroblasts from anAT patient. Data are mean ± SEM of n = 3 independent experiments (forMRC 5+Rap cells) and mean ± SD of n = 2 independent experiments (forAT cells).Representative Western blots of
mTORC 1 activity, measured by p70S6K phosphorylation (T389) in wild‐type andPGC ‐1β −/−MEF s overexpressing RhebN153T (1 day after 10‐Gy irradiation). Data are representative of three independent experiments.Effect of rapamycin supplementation on Sen‐β‐Gal activity in wild‐type and
PGC ‐1β −/−MEF s, 10 days after 10‐Gy X‐ray. Data are mean ± SEM of n = 3 independent experiments (at least 100 cells were analysed per condition). Asterisks denote a statistical significance at P < 0.05 using one‐way ANOVA.

ROS levels (DHE intensity) and mean number (N) of γH2A.X foci aftermTOR knockdown (72 h) in proliferating and senescent (2 days after 20‐Gy X‐ray)MRC 5 fibroblasts. Data are mean ± SEM of n = 3 independent experiments; asterisks denote a statistical significance at P < 0.05 using one‐wayANOVA .ROS levels (DHE intensity) and mean number (N) of γH2A.X foci in proliferating and senescent (3 days after 20‐Gy X‐ray)MRC 5 fibroblasts treated with or without 100 nM rapamycin and/or 2.5 mM of the antioxidantNAC . Data are mean ± SEM of n = 3 independent experiments; asterisks denote a statistical significance at P < 0.05 using one‐wayANOVA .(top) Scheme illustrating the experimental design: human
MRC 5 fibroblasts were irradiated with 20‐Gy X‐ray and treated at day 3 afterIR with 10 μM of theATM inhibitor (ATM i)KU 55933 and/or 100 nM rapamycin (Rap); (bottom) Effect of single or combined inhibition ofATM andmTORC 1 on the mean number (N) of γH2A.X foci, Sen‐β‐Gal activity and p21 expression in proliferating and senescent (10 days after 20‐Gy X‐ray)MRC 5 fibroblasts. Data are mean ± SEM of n = 3 independent experiments. Western blots are representative of three independent experiments; asterisks denote a statistical significance at P < 0.05 using one‐wayANOVA .ROS levels (DHE intensity) in proliferating and senescent (3 days after 10‐Gy X‐ray) wild‐type andPGC ‐1β −/−MEF s (top) andPGC ‐1β‐overexpressingMEF s (bottom). Data are mean ± SEM of n = 3 independent experiments; asterisks denote a statistical significance at P < 0.05 using one‐wayANOVA .(top) Representative images and quantification of immunofluorescence staining against
FLAG ‐PGC ‐1β (red) and 53BP 1 (green) inPGC ‐1β‐overexpressingMEF s cultured at 3% O2, with or without 250 μM of the antioxidant Trolox (scale bar = 10 μm). Data are mean ± SEM, n = 3 independent experiments; asterisks denote a statistical significance at P < 0.05 using one‐wayANOVA .(top) Effect of overexpression of mutated Rheb (N153T) and (bottom) effect of 100 nM rapamycin on the mean number (N) of 53
BP 1 foci in proliferating and senescent (3 days after 10‐Gy X‐ray) wild‐type andPGC ‐1β −/−MEF s. Data are mean ± SEM of n = 3 independent experiments (at least 125 cells were analysed per condition). Asterisks denote a statistical significance at P < 0.05 using one‐way ANOVA.
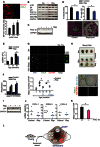
(top) Representative image of immunofluorescence double staining for the mitochondrial protein
MT ‐CO 1 and theDDR marker γH2A.X (scale bar = 5 μm) and (bottom) quantification ofMT ‐CO 1 intensity versus the number of γH2A.X foci in hepatocytes from 12‐month‐old mice. Data are mean ± SEM of n = 3 mice (at least 30 cells were analysed per mouse); asterisks denote a statistical significance at P < 0.05 using one‐way ANOVA.Representative Westerns blots of
pS 6, S6, p21,PGC ‐1β,MT ‐CO 1 andNDUFB 8 protein expression in mouse liver tissue at 3 and 12 months of age. Data are from n = 3 mice per group.Effect of 4 months of rapamycin‐supplemented diet on
PGC ‐1β expression in the liver tissue of 16‐month‐old mice. Data are from n = 3 mice per group.(top) Quantification of mitochondrial number per cross‐section and mitochondrial volume fraction (%Vv) in hepatocytes from 16‐month‐old mice with or without 4 months of rapamycin diet. Data are mean ± SEM of n = 3 mice per group (at least 20 cells were analysed per mouse); (bottom) Representative electron micrographs of hepatocytes from 16‐month‐old mice with or without 4 months of rapamycin diet (mitochondria are labelled in pink). Scale bar = 5 μm. Asterisk denotes a statistical significance at P < 0.05 using two‐tailed t‐test.
mt
DNA copy number (measured byqPCR ) in mice liver tissue at 3, 12, 16 months and at 16 months after 4 months of rapamycin diet. Data are mean ± SEM of n = 3–4 mice per group; Asterisks denote a statistical significance at P < 0.05 using one‐wayANOVA .Oxygen consumption rates (
OCR ) in isolated liver mitochondria from 16‐month‐old mice fed with or without rapamycin for 4 months, in the presence of pyruvate/malate. StateIII was induced by the injection ofADP . StateIV was induced by the inhibition of theATP synthase with oligomycin, and uncoupled respiration rates were determined by the injection ofFCCP . Antimycin A (AA ) was used to determine background, non‐mitochondrialOXPHOS ,OCR . Data are mean ± SEM of n = 5 mice per group.(top) Representative immuno‐Telo
FISH images of hepatocytes from 3‐ and 15‐month‐old mice with or without rapamycin (12‐month diet). Co‐localizing foci are amplified in the right panel (amplified images are from single Z‐planes where co‐localization was found); (bottom) Dot plot graph of telomere‐associated foci (TAF ) in 3‐, 15‐ and 16‐month‐old mice (15‐ and 16‐month‐old mice were fed with rapamycin for 12 and 4 months, respectively). Data are from n = 3 to 9 mice per group (at least 50 cells were analysed per mice). Values are the mean for individual animals, with the horizontal line representing group mean. Asterisk denotes P < 0.05 using an independent samples t‐test.(top) 4‐month‐old and 15‐month‐old mice livers [control (−) or rapamycin (+)] stained with Sen‐β‐Gal solution (Sen‐β‐Gal activity is evidenced by blue staining). Data are from n = 3 mice per group; (bottom) Representative image showing Sen‐β‐Gal staining (Sen‐β‐Gal activity is evidenced by blue staining) in hepatocytes and corresponding immuno‐Telo
FISH (arrows represent co‐localizing foci); asterisks denote a statistical significance at P < 0.05 using one‐wayANOVA .Representative Western blot showing the effect of 4‐month rapamycin feeding on p21 expression in 16‐month‐old mice. Data are from n = 3 mice per group.
Effect of 4‐month rapamycin feeding on
mRNA expression of theSASP componentsCXCL 1,CXCL 5 and inhibin A in liver tissue of 16‐month‐old mice. Data are from n = 5 mice per condition; asterisks denote a statistical significance at P < 0.05 using two‐tailed t‐test.Mean number of
TAF in hepatocytes of wild‐type andPGC ‐1β −/− mice with 18 months of age. Data are mean ± SEM of n = 4 mice per group; asterisks denote a statistical significance at P < 0.05 using two‐tailed t‐test.Scheme represents overall hypothesis: feedback loop between
DDR ,mTORC 1 and mitochondrial biogenesis stabilizes cellular senescence, which are key factors for the development of the senescence‐associated pro‐oxidant and pro‐inflammatory phenotypes.
Comment in
-
Mitochondria and senescence: new actors for an old play.EMBO J. 2016 Apr 1;35(7):701-2. doi: 10.15252/embj.201694025. Epub 2016 Feb 23. EMBO J. 2016. PMID: 26905295 Free PMC article.
References
-
- Acosta JC, O'Loghlen A, Banito A, Guijarro MV, Augert A, Raguz S, Fumagalli M, Da Costa M, Brown C, Popov N, Takatsu Y, Melamed J, d'Adda di Fagagna F, Bernard D, Hernando E, Gil J (2008) Chemokine signaling via the CXCR2 receptor reinforces senescence. Cell 133: 1006–1018 - PubMed
-
- Acosta JC, Banito A, Wuestefeld T, Georgilis A, Janich P, Morton JP, Athineos D, Kang T‐W, Lasitschka F, Andrulis M, Pascual G, Morris KJ, Khan S, Jin H, Dharmalingam G, Snijders AP, Carroll T, Capper D, Pritchard C, Inman GJ et al (2013) A complex secretory program orchestrated by the inflammasome controls paracrine senescence. Nat Cell Biol 15: 978–990 - PMC - PubMed
-
- d'Adda di Fagagna F, Reaper PM, Clay‐Farrace L, Fiegler H, Carr P, von Zglinicki T, Saretzki G, Carter NP, Jackson SP (2003) A DNA damage checkpoint response in telomere‐initiated senescence. Nature 426: 194–198 - PubMed
Publication types
MeSH terms
Grants and funding
- MC_G0802535/MRC_/Medical Research Council/United Kingdom
- MC_UU_12012/2/MRC_/Medical Research Council/United Kingdom
- BB/H022384/1/BB_/Biotechnology and Biological Sciences Research Council/United Kingdom
- G0400192/MRC_/Medical Research Council/United Kingdom
- BB/K017314/1/BB_/Biotechnology and Biological Sciences Research Council/United Kingdom
- G0700718/MRC_/Medical Research Council/United Kingdom
- BB/F010966/1/BB_/Biotechnology and Biological Sciences Research Council/United Kingdom
- MR/K006312/1/MRC_/Medical Research Council/United Kingdom
- P30 CA021765/CA/NCI NIH HHS/United States
- MR/K001949/1/MRC_/Medical Research Council/United Kingdom
- BB/K019260/1/BB_/Biotechnology and Biological Sciences Research Council/United Kingdom
- BB/I020748/1/BB_/Biotechnology and Biological Sciences Research Council/United Kingdom
- R01 AI044828/AI/NIAID NIH HHS/United States
- MR/L016354/1/MRC_/Medical Research Council/United Kingdom
LinkOut - more resources
Full Text Sources
Other Literature Sources
Medical
Molecular Biology Databases
Research Materials
Miscellaneous

