

Concussion Incidence in Professional Football: Position-Specific Analysis With Use of a Novel Metric
- PMID: 26848481
- PMCID: PMC4731682
- DOI: 10.1177/2325967115622621
Concussion Incidence in Professional Football: Position-Specific Analysis With Use of a Novel Metric
Abstract
Background: In the United States alone, millions of athletes participate in sports with potential for head injury each year. Although poorly understood, possible long-term neurological consequences of repetitive sports-related concussions have received increased recognition and attention in recent years. A better understanding of the risk factors for concussion remains a public health priority. Despite the attention focused on mild traumatic brain injury (mTBI) in football, gaps remain in the understanding of the optimal methodology to determine concussion incidence and position-specific risk factors.
Purpose: To calculate the rates of concussion in professional football players using established and novel metrics on a group and position-specific basis.
Study design: Case-control study; Level of evidence, 3.
Methods: Athletes from the 2012-2013 and 2013-2014 National Football League (NFL) seasons were included in this analysis of publicly available data. Concussion incidence rates were analyzed using established (athlete exposure [AE], game position [GP]) and novel (position play [PP]) metrics cumulatively, by game unit and position type (offensive skill players and linemen, defensive skill players and linemen), and by position.
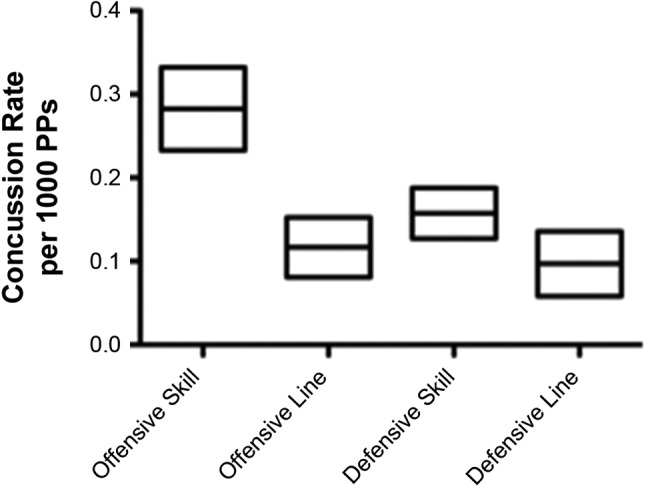
Results: In 480 games, there were 292 concussions, resulting in 0.61 concussions per game (95% CI, 0.54-0.68), 6.61 concussions per 1000 AEs (95% CI, 5.85-7.37), 1.38 concussions per 100 GPs (95% CI, 1.22-1.54), and 0.17 concussions per 1000 PPs (95% CI, 0.15-0.19). Depending on the method of calculation, the relative order of at-risk positions changed. In addition, using the PP metric, offensive skill players had a significantly greater rate of concussion than offensive linemen, defensive skill players, and defensive linemen (P < .05).
Conclusion: For this study period, concussion incidence by position and unit varied depending on which metric was used. Compared with AE and GP, the PP metric found that the relative risk of concussion for offensive skill players was significantly greater than other position types. The strengths and limitations of various concussion incidence metrics need further evaluation.
Clinical relevance: A better understanding of the relative risks of the different positions/units is needed to help athletes, team personnel, and medical staff make optimal player safety decisions and enhance rules and equipment.
Keywords: National Football League; athlete exposures; concussion; concussion incidence; game positions; mTBI; position plays; risk assessment.
Conflict of interest statement
The authors declared that they have no conflicts of interest in the authorship and publication of this contribution.
Figures


References
-
- 2013-14 High School Sports Participation Survey. Indianapolis, Indiana: The National Federation of State High School Associations; 2014.
-
- Concussion Watch. 2014. http://www.pbs.org/wgbh/pages/frontline/concussion-watch/. Accessed May 15, 2014.
-
- Cusimano MD. Canadian minor hockey participants’ knowledge about concussion. Can J Neurol Sci. 2009;36:315–320. - PubMed
LinkOut - more resources
Full Text Sources
Other Literature Sources
Miscellaneous
