

Syntaxin-3 Binds and Regulates Both R- and L-Type Calcium Channels in Insulin-Secreting INS-1 832/13 Cells
- PMID: 26848587
- PMCID: PMC4743851
- DOI: 10.1371/journal.pone.0147862
Syntaxin-3 Binds and Regulates Both R- and L-Type Calcium Channels in Insulin-Secreting INS-1 832/13 Cells
Abstract
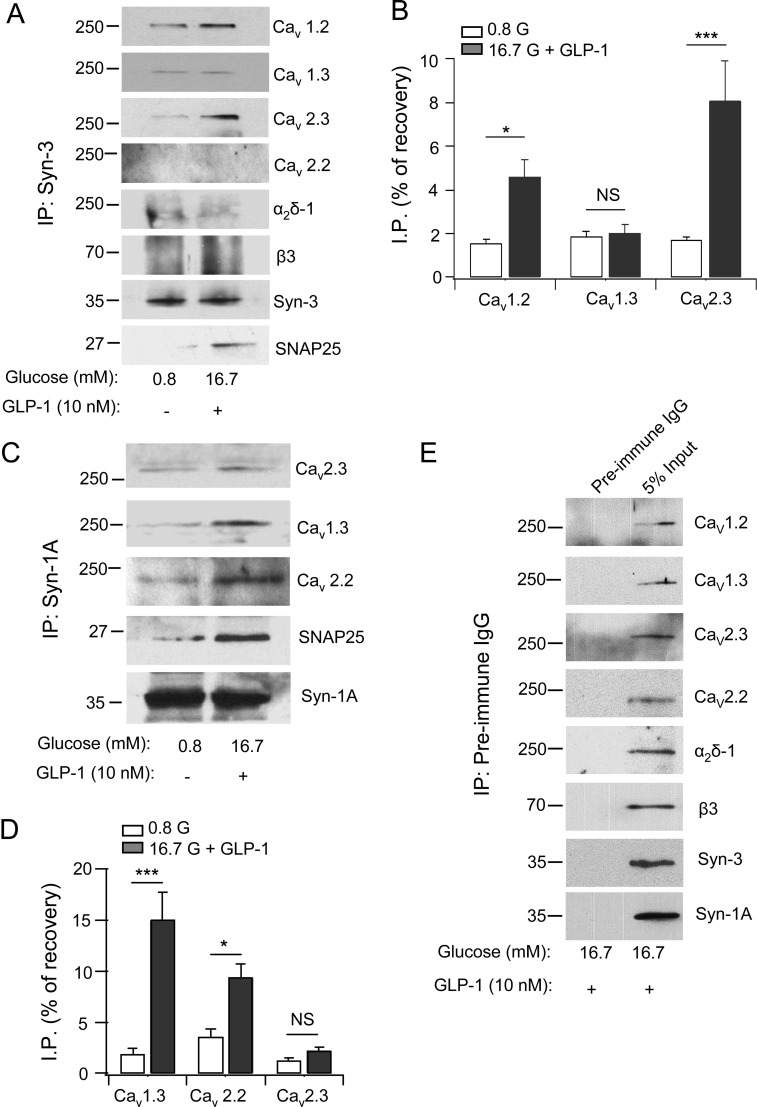
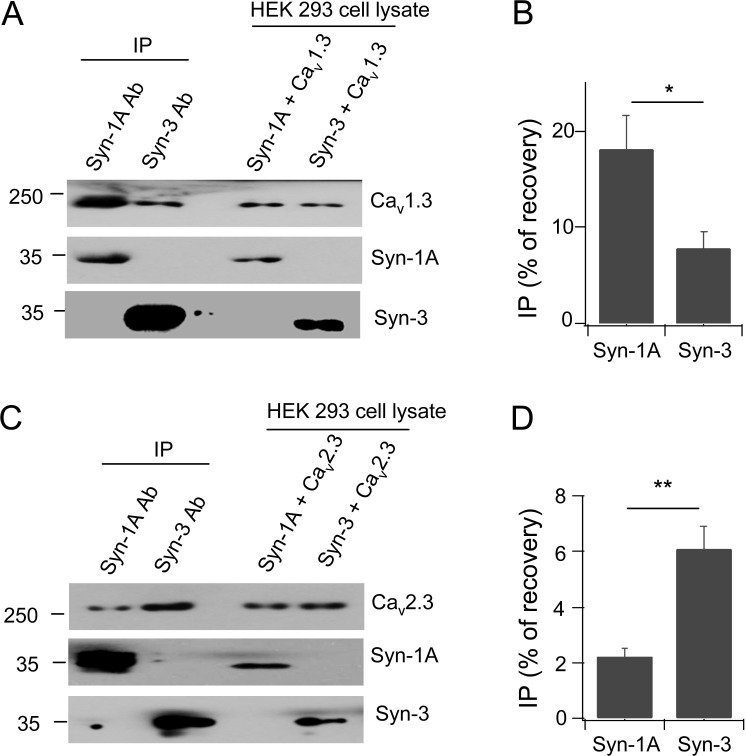
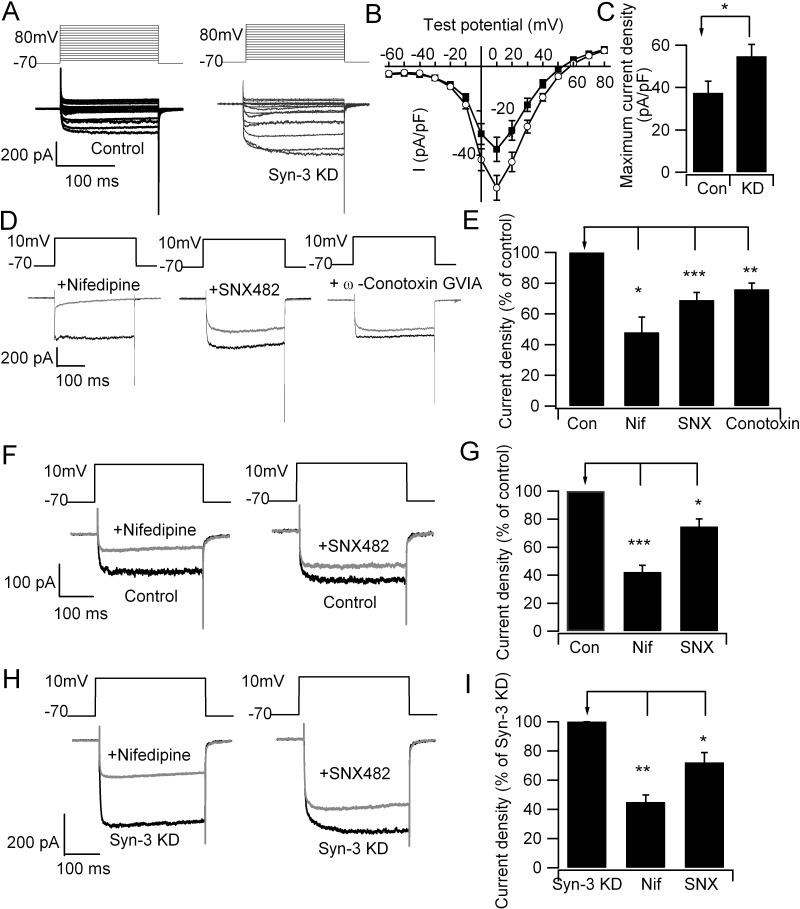
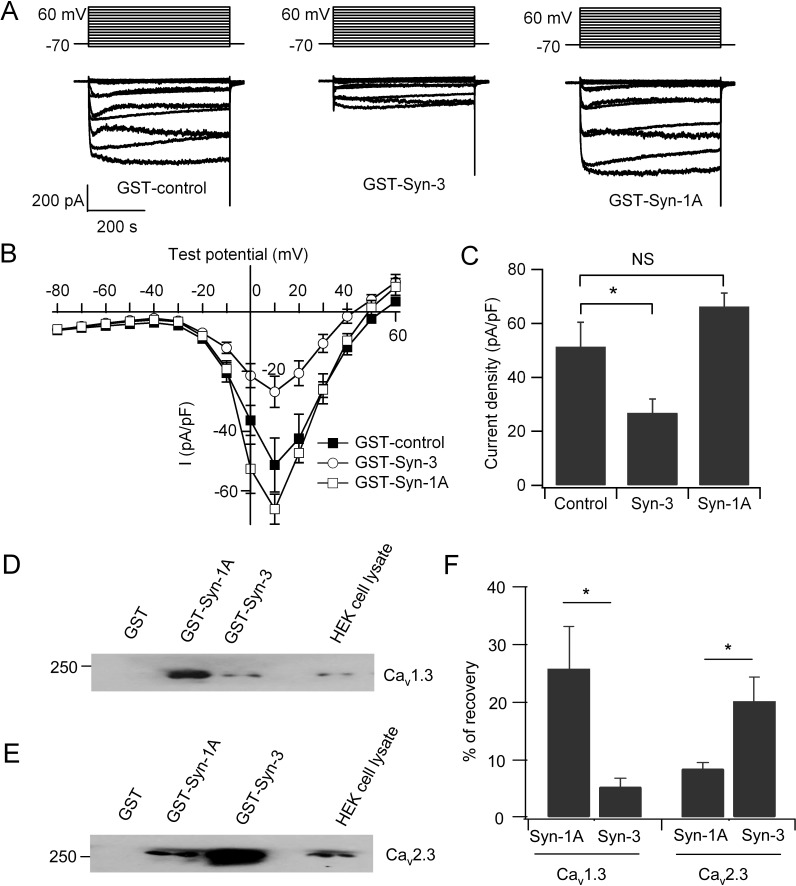
Syntaxin (Syn)-1A mediates exocytosis of predocked insulin-containing secretory granules (SGs) during first-phase glucose-stimulated insulin secretion (GSIS) in part via its interaction with plasma membrane (PM)-bound L-type voltage-gated calcium channels (Cav). In contrast, Syn-3 mediates exocytosis of newcomer SGs that accounts for second-phase GSIS. We now hypothesize that the newcomer SG Syn-3 preferentially binds and modulates R-type Cav opening, which was postulated to mediate second-phase GSIS. Indeed, glucose-stimulation of pancreatic islet β-cell line INS-1 induced a predominant increase in interaction between Syn-3 and Cavα1 pore-forming subunits of R-type Cav2.3 and to lesser extent L-type Cavs, while confirming the preferential interactions between Syn-1A with L-type (Cav1.2, Cav1.3) Cavs. Consistently, direct binding studies employing heterologous HEK cells confirmed that Syn-3 preferentially binds Cav2.3, whereas Syn-1A prefers L-type Cavs. We then used siRNA knockdown (KD) of Syn-3 in INS-1 to study the endogenous modulatory actions of Syn-3 on Cav channels. Syn-3 KD enhanced Ca2+ currents by 46% attributed mostly to R- and L-type Cavs. Interestingly, while the transmembrane domain of Syn-1A is the putative functional domain modulating Cav activity, it is the cytoplasmic domain of Syn-3 that appears to modulate Cav activity. We conclude that Syn-3 may mimic Syn-1A in the ability to bind and modulate Cavs, but preferring Cav2.3 to perhaps participate in triggering fusion of newcomer insulin SGs during second-phase GSIS.
Conflict of interest statement
Figures
Similar articles
-
Syntaxin 2 Acts as Inhibitory SNARE for Insulin Granule Exocytosis.Diabetes. 2017 Apr;66(4):948-959. doi: 10.2337/db16-0636. Epub 2017 Jan 23. Diabetes. 2017. PMID: 28115395 Free PMC article.
-
Syntaxin-4 mediates exocytosis of pre-docked and newcomer insulin granules underlying biphasic glucose-stimulated insulin secretion in human pancreatic beta cells.Diabetologia. 2015 Jun;58(6):1250-9. doi: 10.1007/s00125-015-3545-4. Epub 2015 Mar 13. Diabetologia. 2015. PMID: 25762204
-
RalA GTPase tethers insulin granules to L- and R-type calcium channels through binding α2 δ-1 subunit.Traffic. 2013 Apr;14(4):428-39. doi: 10.1111/tra.12047. Epub 2013 Feb 14. Traffic. 2013. PMID: 23346930
-
SNAREing voltage-gated K+ and ATP-sensitive K+ channels: tuning beta-cell excitability with syntaxin-1A and other exocytotic proteins.Endocr Rev. 2007 Oct;28(6):653-63. doi: 10.1210/er.2007-0010. Epub 2007 Sep 18. Endocr Rev. 2007. PMID: 17878408 Review.
-
The role of voltage-gated calcium channels in pancreatic beta-cell physiology and pathophysiology.Endocr Rev. 2006 Oct;27(6):621-76. doi: 10.1210/er.2005-0888. Epub 2006 Jul 25. Endocr Rev. 2006. PMID: 16868246 Review.
Cited by
-
Syntaxin 2 Acts as Inhibitory SNARE for Insulin Granule Exocytosis.Diabetes. 2017 Apr;66(4):948-959. doi: 10.2337/db16-0636. Epub 2017 Jan 23. Diabetes. 2017. PMID: 28115395 Free PMC article.
-
Kv2.1 clusters on β-cell plasma membrane act as reservoirs that replenish pools of newcomer insulin granule through their interaction with syntaxin-3.J Biol Chem. 2018 May 4;293(18):6893-6904. doi: 10.1074/jbc.RA118.002703. Epub 2018 Mar 16. J Biol Chem. 2018. PMID: 29549124 Free PMC article.
-
Characteristics of Berberine Effects on Insulin Exocytosis in Pancreatic β Cells.FASEB J. 2025 Jun 15;39(11):e70718. doi: 10.1096/fj.202501267R. FASEB J. 2025. PMID: 40497406 Free PMC article.
-
Complement promotes endothelial von Willebrand factor and angiopoietin-2 release in obstructive sleep apnea.Sleep. 2021 Apr 9;44(4):zsaa286. doi: 10.1093/sleep/zsaa286. Sleep. 2021. PMID: 33351148 Free PMC article.
-
Conventional and Unconventional Mechanisms by which Exocytosis Proteins Oversee β-cell Function and Protection.Int J Mol Sci. 2021 Feb 12;22(4):1833. doi: 10.3390/ijms22041833. Int J Mol Sci. 2021. PMID: 33673206 Free PMC article. Review.
References
-
- Wheeler MB, Sheu L, Ghai M, Bouquillon A, Grondin G, Weller U, et al. Characterization of SNARE protein expression in cell lines and pancreatic islets. Endocrinology. 1996; 137(4):1340–8. - PubMed
-
- Huang XH, Pasyk EA, Kang YH, Sheu L, Wheeler MB, Trimble WS, et al. Ca2+ influx and cAMP elevation overcame botulinum toxin A but not tetanus toxin inhibition of insulin exocytosis. Am J Physiol Cell Physiol. 2001; 281(3):C740–C750. - PubMed
Publication types
MeSH terms
Substances
Grants and funding
LinkOut - more resources
Full Text Sources
Other Literature Sources
Molecular Biology Databases
Miscellaneous
