. 2016 Apr 12;7(15):19468-82.
doi: 10.18632/oncotarget.7153.

Bile acid-FXRα pathways regulate male sexual maturation in mice

Affiliations

Bile acid-FXRα pathways regulate male sexual maturation in mice

Marine Baptissart et al. Oncotarget. .

Abstract

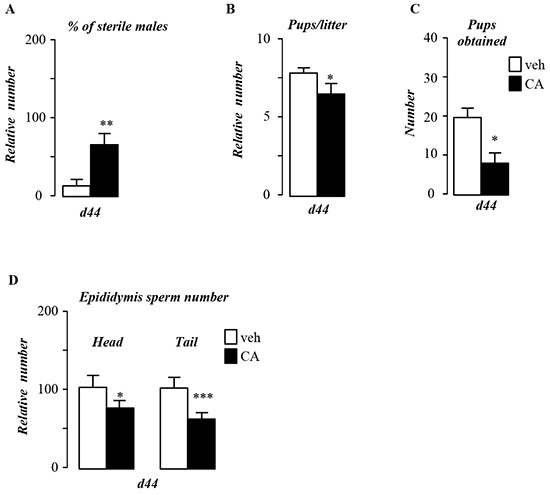
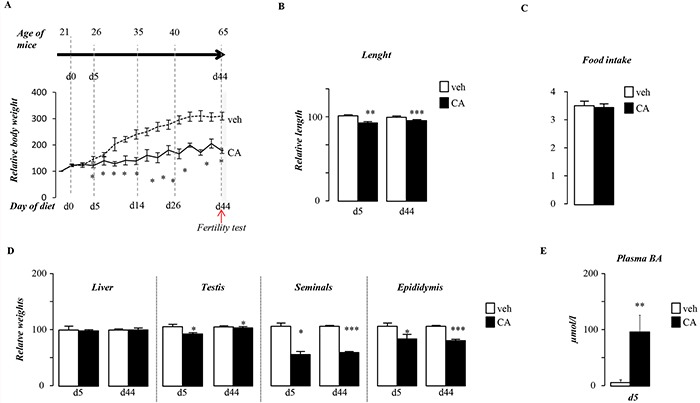
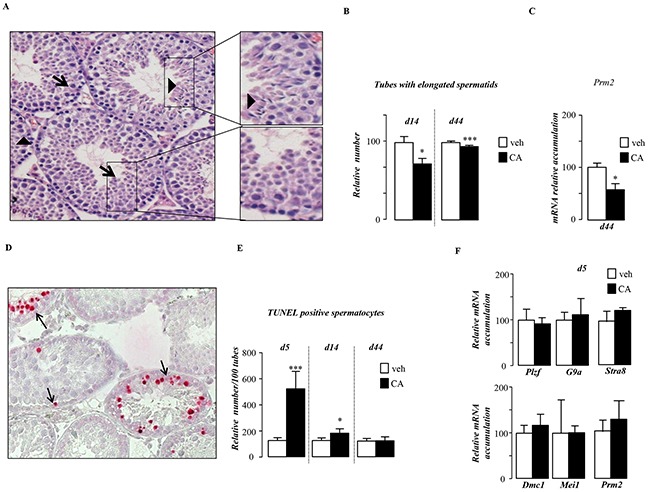
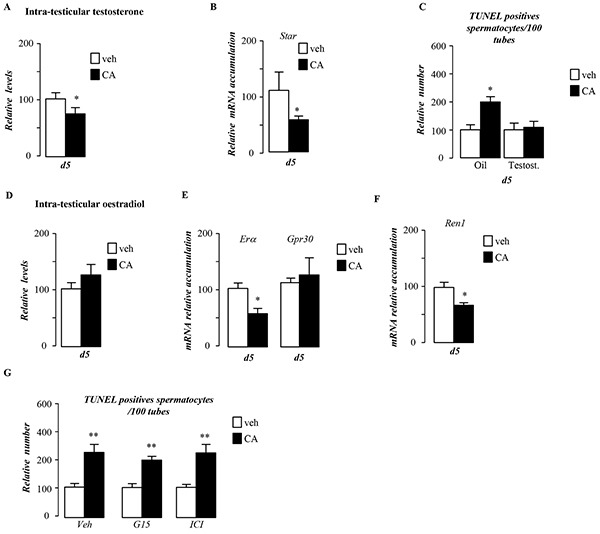
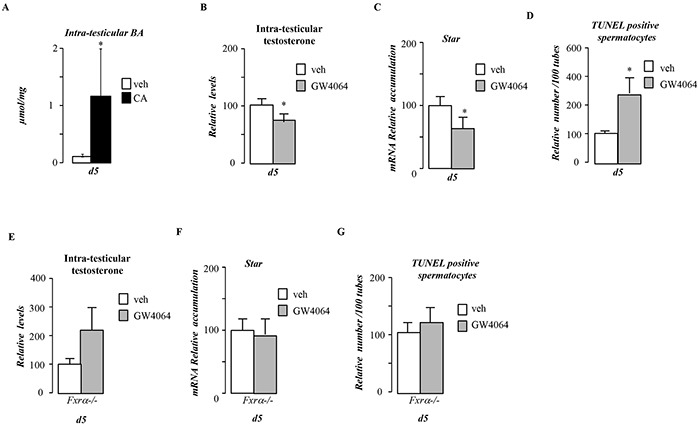
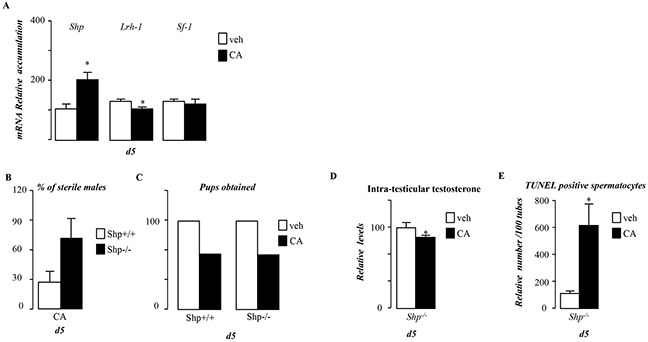
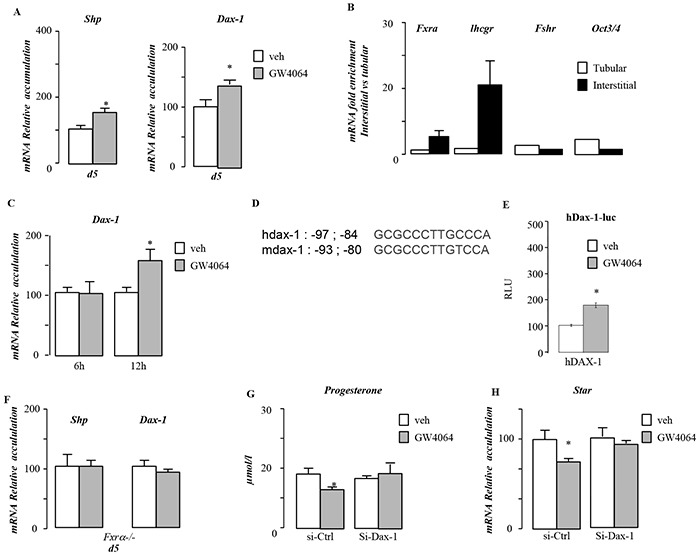
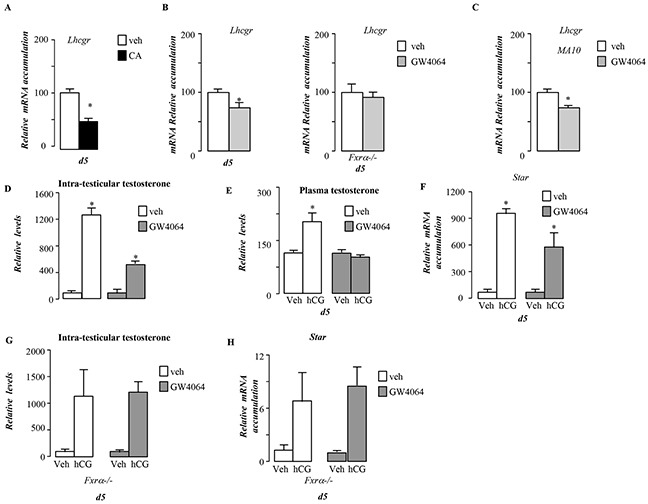
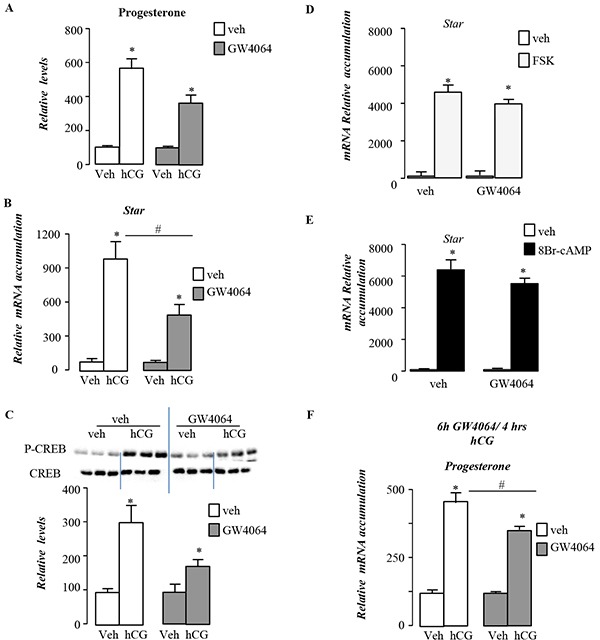
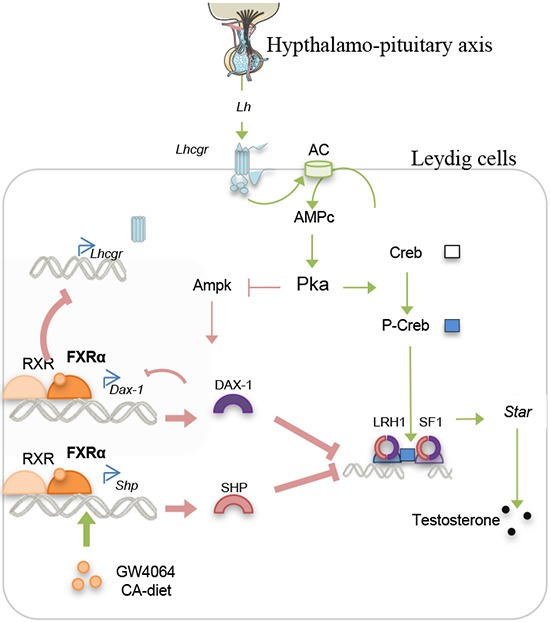
The bile acid receptor Farnesol-X-Receptor alpha (FRXα) is a member of the nuclear receptor superfamily. FRXα is expressed in the interstitial compartment of the adult testes, which contain the Leydig cells. In adult, short term treatment (12 hours) with FRXα agonist inhibits the expression of steroidogenic genes via the induction of the Small heterodimer partner (SHP). However the consequences of FRXα activation on testicular pathophysiology have never been evaluated. We demonstrate here that mice fed a diet supplemented with bile acid during pubertal age show increased incidence of infertility. This is associated with altered differentiation and increase apoptosis of germ cells due to lower testosterone levels. At the molecular level, next to the repression of basal steroidogenesis via the induction expression of Shp and Dax-1, two repressors of steroidogenesis, the main action of the BA-FRXα signaling is through lowering the Leydig cell sensitivity to the hypothalamo-pituitary axis, the main regulator of testicular endocrine function. In conclusion, BA-FRXα signaling is a critical actor during sexual maturation.

Keywords: bile acid; germ cell apoptosis; hypothalamo-pituitary axis; nuclear receptors; testicular steroidogenesis.


Conflict of interest statement

CONFLICTS OF INTEREST

The authors declare no conflict of interest.

Figures

Figure 1
Figure 1. Pubertal exposure to BA alters male fertility
A. Percentage of infertile males. B. Number of pups per litter. C. Total number of pups obtained per group. D. Sperm count in the epididymis head and tail of control or CA fed groups for 44 days. In all of the panels data are expressed as the means ± SEM. Statistical analysis:*, p<0.05; **, p<0.01, ***, p<0.005 vs. control diet group.
Figure 2
Figure 2. Pubertal exposure to BA alters pubertal growth
A. Overall body weight gain of males exposed to control or CA diets. B. Body length of males after 5 or 44 days of either control or CA diet. C. Overall food intake of male fed control or CA diet. D. Liver, testis, epididymis and seminal relative gross weights in C57Bl/6J mice fed 5 or 44 days of exposure. E. Plasma bile acid levels in males exposed to control or CA diets for 5days. In all of the panels data are expressed as the means ± SEM. Statistical analysis: *, p<0.05; **, p<0.01, ***, p<0.005 vs.respective control group.
Figure 3
Figure 3. Pubertal exposure to BA alters germ cell survival
A. Representative micrographs of hematoxylin/eosin-stained testes of mice fed CA-diet for 14 days. The arrow-head indicates tubules with elongated spermatids; arrows indicate tubes without elongated spermatids. The original magnification was x200. B. Quantification of the number of tubules with elongated spermatids per 100 seminiferous tubules after 14 and 44 days of control or CA-diet (n=10-20 per group). C. Testicular mRNA expression of Prm2 normalized to β-actin levels in whole testis of C57Bl/6J mice fed control or CA diets for 44 days (n=10 to 15 per group). D. Apoptosis in mice exposed to control or CA diets (n=10-20 per group) analyzed by TUNEL staining. Representative micrographs of testis exposed to control or CA diets for 5 days. The arrows indicate apoptotic spermatocytes. The original magnification was x200. E. Quantification of TUNEL analyses after 5, 14 or 44 days of diet exposure. The number of TUNEL-positive is indicated as the number of positive cells per 100 seminiferous tubules (n=10-20). F. Testicular mRNA expression of Plzf, G9a, Stra8, Dmc1, Mei1 and Prm2 normalized to β-actin levels in whole testis of C57Bl/6J mice fed control or CA diets for 5 days (n=10 to 15 per group). Control diet treated mice were arbitrarily fixed at 100%. In all of the panels data are expressed as the means ± SEM. Statistical analysis: *, p<0.05; **, p<0.01, ***, p<0.005 vs.respective control group.
Figure 4
Figure 4. Pubertal BA exposure regulates testicular androgen metabolism
A. Relative intra-testicular testosterone levels in C57Bl/6J mice fed control or CA diet for 5 days (n=6-20 per group). B. Testicular mRNA expression of Star normalized to β-actin levels in whole testis of C57Bl/6J mice fed control or CA diets for 5 days (n=10 to 15 per group). C. Quantification of TUNEL analyses after testosterone or vehicle treatment in males fed control or CA diets for 5 days. The number of TUNEL-positive spermatocytes is indicated as the number of positive cells per 100 seminiferous tubules (n=10-20). D. Relative intra-testicular estrogen levels in C57Bl/6J mice fed control or CA diet for 5 days (n=6-20 per group). E. Testicular mRNA expression of Erα and Gpr30 normalized to β-actin levels in whole testis of C57Bl/6J mice fed control or CA diets for 5 days (n=10 to 15 per group). F. Testicular mRNA expression of Renin-1 normalized to β-actin levels in whole testis of C57Bl/6J mice fed control or CA diets for 5 days (n=10 to 15 per group). G. Quantification of the number of TUNEL positive cells per 100 seminiferous tubules after 5 days of control or CA-diet co-treated with either vehicle, G15 or ICI (n=5-10 per group). In all panels control diet or vehicle treated group were arbitrarily fixed at 100% and data are expressed as the means ± SEM. Statistical analysis: *, p<0.05; **, p<0.01, ***, p<0.005 vs. respective control group.
Figure 5
Figure 5. Pubertal BA exposure impacts testis physiology via FXRα
A. Relative intra-testicular bile acid levels in C57Bl6.mice fed control or CA diet for 5 days (n=5-6 per group). B. Relative intra-testicular testosterone levels in C57Bl6.mice treated with vehicle or GW4064 for 5 days (n=5-6 per group). C. Testicular mRNA expression of Star normalized to β-actin levels in whole testis of C57Bl/6J mice treated with vehicle or GW4064 for 5 days (n=10 to 15 per group). D. Quantification of TUNEL analyses in males treated with vehicle or GW4064 for 5 days. The number of TUNEL-positive spermatocytes is indicated as the number of positive cells per 100 seminiferous tubules (n=10-20). E. Relative intra-testicular testosterone levels in Fxrα−/− male mice treated with vehicle or GW4064 for 5 days (n=5-6 per group). F. Testicular mRNA expression of Star normalized to β-actin levels in whole testis of Fxrα−/− male mice mice treated with vehicle or GW4064 for 5 days (n=10 to 15 per group). G. Quantification of TUNEL analyses in Fxrα−/− male mice treated with vehicle or GW4064 for 5 days. The number of TUNEL-positive spermatocytes is indicated as the number of positive cells per 100 seminiferous tubules (n=10-20). In all panels control diet or vehicle treated group were arbitrarily fixed at 100% and data are expressed as the means ± SEM. Statistical analysis: *, p<0.05; **, p<0.01, ***, p<0.005 vs.respective control group.
Figure 6
Figure 6. BA act in though FXRα in a SHP independent manner in pubertal males
A. Testicular mRNA expression of Shp, Lrh-1and Sf-1 normalized to β-actin levels in whole testis of C57Bl/6J mice fed control or CA diets for 5 days (n=5 to 10 per group). B. Percentage of infertile males in Shp+/+ and Shp−/− exposed to CA diet for 44 days. C. Total number of pups obtained per group in Shp+/+ and Shp−/− exposed to control or CA diet for 44 days. D. Relative intra-testicular testosterone levels in Shp−/− mice fed control or CA diet for 5 days (n=6-10 per group) E. Quantification of TUNEL analyses in Shp−/− males fed control or CA diets for 5 days. The number of TUNEL-positive spermatocytes is indicated as the number of positive cells per 100 seminiferous tubules (n=6-10). In all of the panels data are expressed as the means ± SEM. Statistical analysis:*, p<0.05; **, p<0.01, ***, p<0.005 vs.respective control group.
Figure 7
Figure 7. Dax-1 is a target gene of FXRα
A. Testicular mRNA expression of Shp and Dax-1 normalized to b-actin levels in whole testis of C57Bl/6J mice treated with vehicle or GW4064 for 5 days (n=5 to 10 per group). B. mRNA expression of Fxrα, Lhcgr, Fshr and Oct3/4 normalized to β-actin levels in interstitial and tubular compartment of 15-days-old testis of C57Bl/6J. C. mRNA expression of Dax-1 normalized to β-actin levels in MA-10 cells treated for 6hours or 12 hours with vehicle or GW4064 (n=10 per group). D. Sequences of FXRE putative biding site (IR1) in human and mouse DAX-1 promoters. E. CV1cells were transfected with pCMX-mFXRα, pCMX-mRXRα, or both receptor plasmids in the presence of the 1.2kbDAX-1 promoter (hDAX1) linked to luciferase. Cells were treated with GW4064 (1 μM). F. Testicular mRNA expression of Shp and Dax-1 normalized to β-actin levels in whole testis of Fxrα−/− mice treated with vehicle or GW4064 for 5 days (n=5 to 10 per group). G. Relative progesterone levels in medium of MA10 cells transfected with siRNA-control or siRNA directed against Dax-1 and treated for 12 hours with vehicle or GW4064 (n=6-15 per group). H. mRNA expression of Star normalized to β-actin levels in MA10 cells transfected with siRNA-control or siRNA directed against Dax-1 and treated for 12 hours with vehicle or GW4064 (n=10 to 15 per group). In all of the panels data are expressed as the means ± SEM. Statistical analysis:*, p<0.05; **, p<0.01, ***, p<0.005 vs.respective control group.
Figure 8
Figure 8. BA signaling pathway alters LH/CG sensitivity in pubertal males
A. Testicular mRNA expression of Lhcgr normalized to β-actin levels in whole testis of C57Bl/6J mice fed control or CA diets for 5 days (n=5 to 10 per group). B. Testicular mRNA expression of Lhcgr normalized to β-actin levels in whole testis of C57Bl/6J or Fxrα−/− mice exposed to vehicle or GW4064 for 5 days (n=5 to 10 per group). C. mRNA expression of Lhcgr normalized to β-actin levels in MA-10 cells treated for 6 hours with vehicle or GW4064 (n=10 per group). D. Relative intra-testicular testosterone levels in C57Bl/6J mice treated 5 days with vehicle orGW4064 and then 12 hours with vehicle or hCG (n=5-15 per group). E. Relative plasma testosterone levels in C57Bl/6J mice treated 5 days with vehicle or GW4064 and then 12 hours with veh or hCG (n=5-15 per group). F. Testicular mRNA expression of Star normalized to β-actin levels in whole testis of C57Bl/6J mice treated 5 days with vehicle or GW4064 and then 12hours with veh or hCG. G. Relative intra-testicular testosterone levels in Fxrα−/− mice treated 5 days with vehicle, GW4064 and then 12 hours with vehicle or hCG (n=5-15 per group). H. Testicular mRNA expression of Star normalized to β-actin levels in whole testis of Fxrα−/− mice treated 5 days with vehicle or GW4064 and then 12hours with veh or hCG. In all of the panels data are expressed as the means ± SEM. Statistical analysis:*, p<0.05; **, p<0.01, ***, p<0.005 vs.respective control group.
Figure 9
Figure 9. BA signaling pathway alters LH/CG sensitivity at the Leydig cell level in pubertal males
A. Relative progesterone levels in medium of MA10 cells pre-treated 12h with vehicle or GW4064 and then 4 hours with veh or hCG (n=5-15 per group). B. mRNA expression of Star normalized to β-actin levels in MA10 cells pre-treated 12h with vehicle or GW4064 and then 4 hours with veh or hCG (n=5-15 per group). C. Representative western bots of P-CREB and CREB, and quantification of the P-CREB/CREB ratio in MA10 cells MA10 cells pre-treated 12h with vehicle or GW4064 and then 30min with veh or hCG (n=5-15 per group). D. mRNA expression of Star normalized to β-actin levels in MA10 cells pre-treated 12h with vehicle or GW4064 and then 4 hours with veh or Fsk (n=5-15 per group). E. mRNA expression of Star normalized to β-actin levels in MA10 cells pre-treated 12h with vehicle or GW4064 and then 4 hours with veh or 8Bromo-AMPc (n=5-15 per group). F. Relative progesterone levels in medium of MA10 cells pre-treated 6h with vehicle or GW4064 and then 4 hours with veh or hCG (n=5-10 per group). In all panels data are expressed as the means ± SEM. Statistical analysis:*, p<0.05; **, p<0.01, ***, p<0.005 vs.respective control group.
Figure 10
Figure 10. Proposed model for the action of BA-FXRα pathways on Leydig cells during puberty

Similar articles

Cited by

References

    1. Volle DH, Duggavathi R, Magnier BC, Houten SM, Cummins CL, Lobaccaro J-MA, Verhoeven G, Schoonjans K, Auwerx J. The small heterodimer partner is a gonadal gatekeeper of sexual maturation in male mice. Genes Dev. 2007;21:303–15. - PMC - PubMed
    1. Van Thiel DH, Gavaler JS, Zajko AB, Cobb CF. Consequences of complete bile-duct ligation on the pubertal process in the male rat. J Pediatr Gastroenterol Nutr. 1985;4:616–21. - PubMed
    1. Wilson JD, Leihy MW, Shaw G, Renfree MB. Androgen physiology: unsolved problems at the millennium. Mol Cell Endocrinol. 2002;198:1–5. - PubMed
    1. Watanabe M, Houten SM, Mataki C, Christoffolete MA, Kim BW, Sato H, Messaddeq N, Harney JW, Ezaki O, Kodama T, Schoonjans K, Bianco AC, Auwerx J. Bile acids induce energy expenditure by promoting intracellular thyroid hormone activation. Nature. 2006;439:484–9. - PubMed
    1. Volle DH, Mouzat K, Duggavathi R, Siddeek B, Déchelotte P, Sion B, Veyssière G, Benahmed M, Lobaccaro J-MA. Multiple roles of the nuclear receptors for oxysterols liver X receptor to maintain male fertility. Mol Endocrinol. 2007;21:1014–27. - PubMed

MeSH terms

LinkOut - more resources