Observational Study
. 2016 Feb 4;98(2):287-98.
doi: 10.1016/j.ajhg.2015.12.018.

The HTT CAG-Expansion Mutation Determines Age at Death but Not Disease Duration in Huntington Disease

Affiliations
Observational Study

The HTT CAG-Expansion Mutation Determines Age at Death but Not Disease Duration in Huntington Disease

Jae Whan Keum et al. Am J Hum Genet. .

Abstract

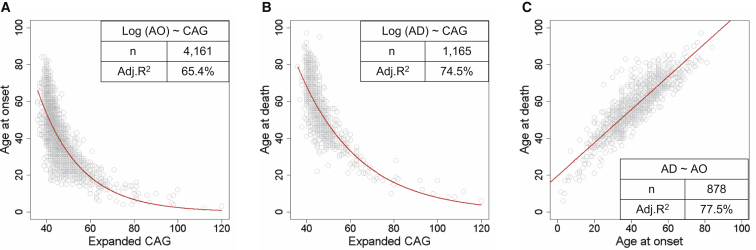
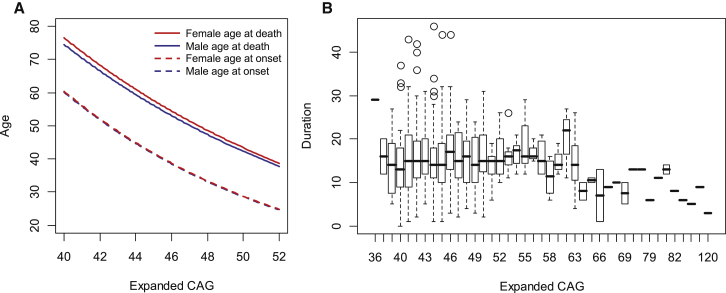
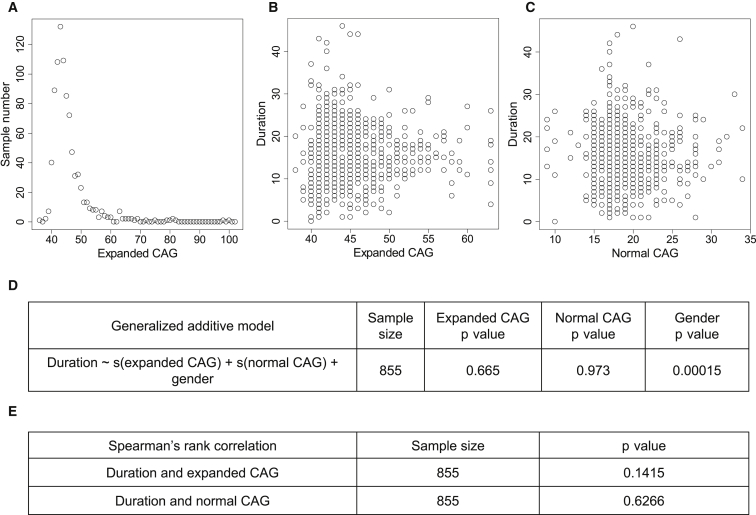
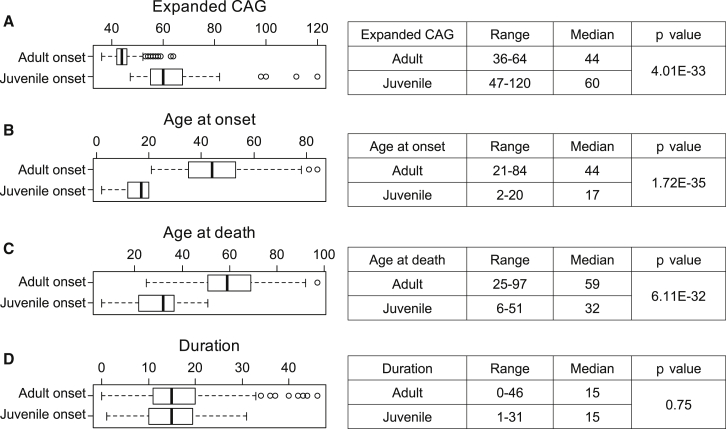
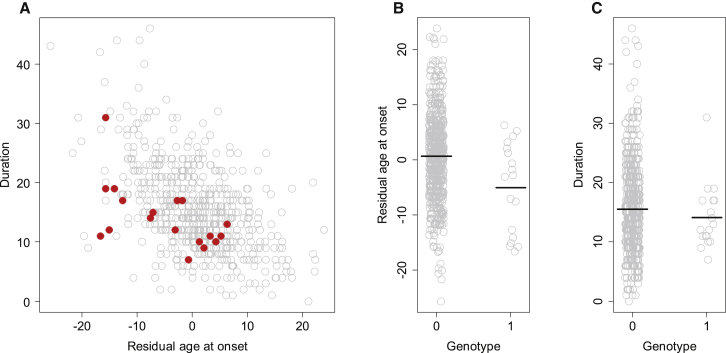
Huntington disease (HD) is caused by an expanded HTT CAG repeat that leads in a length-dependent, completely dominant manner to onset of a characteristic movement disorder. HD also displays early mortality, so we tested whether the expanded CAG repeat exerts a dominant influence on age at death and on the duration of clinical disease. We found that, as with clinical onset, HD age at death is determined by expanded CAG-repeat length and has no contribution from the normal CAG allele. Surprisingly, disease duration is independent of the mutation's length. It is also unaffected by a strong genetic modifier of HD motor onset. These findings suggest two parsimonious alternatives. (1) HD pathogenesis is driven by mutant huntingtin, but before or near motor onset, sufficient CAG-driven damage occurs to permit CAG-independent processes and then lead to eventual death. In this scenario, some pathological changes and their clinical correlates could still worsen in a CAG-driven manner after disease onset, but these CAG-related progressive changes do not themselves determine duration. Alternatively, (2) HD pathogenesis is driven by mutant huntingtin acting in a CAG-dependent manner with different time courses in multiple cell types, and the cellular targets that lead to motor onset and death are different and independent. In this scenario, processes driven by HTT CAG length lead directly to death but not via the striatal pathology associated with motor manifestations. Each scenario has important ramifications for the design and testing of potential therapeutics, especially those aimed at preventing or delaying characteristic motor manifestations.


Figures

Figure 1
Figure 1
Correlation between Age at Death and the Length of the Expanded HTT CAG Repeat (A) Age at onset of motor signs plotted against the expanded CAG-repeat length. (B) Age at death plotted against the expanded CAG-repeat length. (C) Age at death plotted against age at onset for individuals for whom both are known. In each panel, each circle represents a unique HD subject. The red trend line represents a statistical model based on all data points prior to QC analysis and describes the relationship between natural-log-transformed age at onset and expanded CAG-repeat length (A), between natural-log-transformed age at death and expanded CAG-repeat length (B), and between age at death and age at onset (C). A summary of a model, including its formula, sample number (n), and adjusted R2 (Adj. R2) value is provided inside each plot. The larger variance in age at onset (A) than in age at death (B) is not due to statistical artifacts related to sample size, given that the R2 values for age-at-onset models based on randomly picked 1,165 subject sample sets (mean = 0.6537) were similar to those of the original model using all data points.
Figure 2
Figure 2
Distribution of Disease Duration by CAG-Repeat Length (A) Models for age at death (Table 1, model 2) and age at onset were constructed with normally distributed samples and a gender covariate. For the age-at-onset model, gender was included in the model described previously. Blue and red lines represent statistical models for males and females, respectively. Solid and dotted lines represent the CAG age-at-death model and the CAG age-at-onset model, respectively. (B) The distribution of disease duration for each expanded CAG repeat was plotted in a boxplot format. Open circles are outliers defined by a standard interquartile-outlier-identification method. The top, middle, and bottom of the box represent the 75th percentile (upper quartile), median, and 25th percentile (lower quartile) data points, respectively. The higher and lower whiskers indicate the upper quartile plus 1.5× the interquartile range (IQR) and the lower quartile minus 1.5× the IQR, respectively.
Figure 3
Figure 3
Non-parametric Analyses to Test Effects of CAG-Repeat Size on Duration (A) Sample sizes were plotted against expanded CAG repeats for statistical modeling of duration. (B and C) Duration values were plotted against either expanded CAG (B) or normal CAG (C). (D) A generalized linear model (GAM) was constructed to test the effects expanded CAG, normal CAG, and gender on duration in the non-normally distributed data. Expanded CAGs with sample sizes greater than 2 (38–63 CAGs) were used. The p values of independent variables are provided. (E) In addition, Spearman’s rank-correlation analysis was performed for determining whether duration values correlated with the sizes of either expanded or normal CAG repeats.
Figure 4
Figure 4
HD Subjects with Adult Onset and Juvenile Onset Have Similar Durations HD subjects with adult age at onset (>20 years; 823 subjects) or juvenile age at onset (<21 years; 55 subjects) were compared for their expanded CAG repeats (A), age at onset (B), age at death (C), and duration (D) with the Mann-Whitney U test. In each panel, a boxplot summarizes the distribution of the test object (left), and a summary-statistics table is provided (right).
Figure 5
Figure 5
Duration Is Not Associated with rs146353869 On the basis of recent results from a genome-wide association (GWA) analysis, we tested whether duration is altered by a strong genetic modifier tagged by SNP rs146353869 on chromosome 15. HD subjects with the minor allele of this SNP developed clinical symptoms significantly (∼6 years) earlier than did subjects with a comparable expanded CAG length but without the minor allele of rs146353869. (A) Among samples used in our GWA analysis aimed at identifying age-at-onset modifiers, 654 individuals had both age-at-onset and age-at-death data. Disease duration (i.e., age at death minus age at onset) was plotted against residual age at onset. Gray (636 subjects) and red (18 subjects) circles represent HD subjects without and with a minor allele for rs146353869, respectively. (B and C) Residual age at onset (B) and duration (C) of HD subjects without (genotype 0) or with (genotype 1) a minor allele for rs146353869 are plotted. Black horizontal lines represent the mean. Mann-Whitney U tests were performed to compare residual age at death (p value = 0.01) and duration (p value = 0.37) between the two groups of HD subjects differentiated by the rs146353869 genotype.

References

    1. Huntington G. On chorea. Med. Surg. Rep. 1872;26:320–321.
    1. The Huntington’s Disease Collaborative Research Group A novel gene containing a trinucleotide repeat that is expanded and unstable on Huntington’s disease chromosomes. Cell. 1993;72:971–983. - PubMed
    1. Cattaneo E., Zuccato C., Tartari M. Normal huntingtin function: an alternative approach to Huntington’s disease. Nat. Rev. Neurosci. 2005;6:919–930. - PubMed
    1. Bates G.P. History of genetic disease: the molecular genetics of Huntington disease - a history. Nat. Rev. Genet. 2005;6:766–773. - PubMed
    1. Gusella J., MacDonald M. No post-genetics era in human disease research. Nat. Rev. Genet. 2002;3:72–79. - PubMed

Publication types