

A Lower Olfactory Capacity Is Related to Higher Circulating Concentrations of Endocannabinoid 2-Arachidonoylglycerol and Higher Body Mass Index in Women
- PMID: 26849214
- PMCID: PMC4746072
- DOI: 10.1371/journal.pone.0148734
A Lower Olfactory Capacity Is Related to Higher Circulating Concentrations of Endocannabinoid 2-Arachidonoylglycerol and Higher Body Mass Index in Women
Abstract
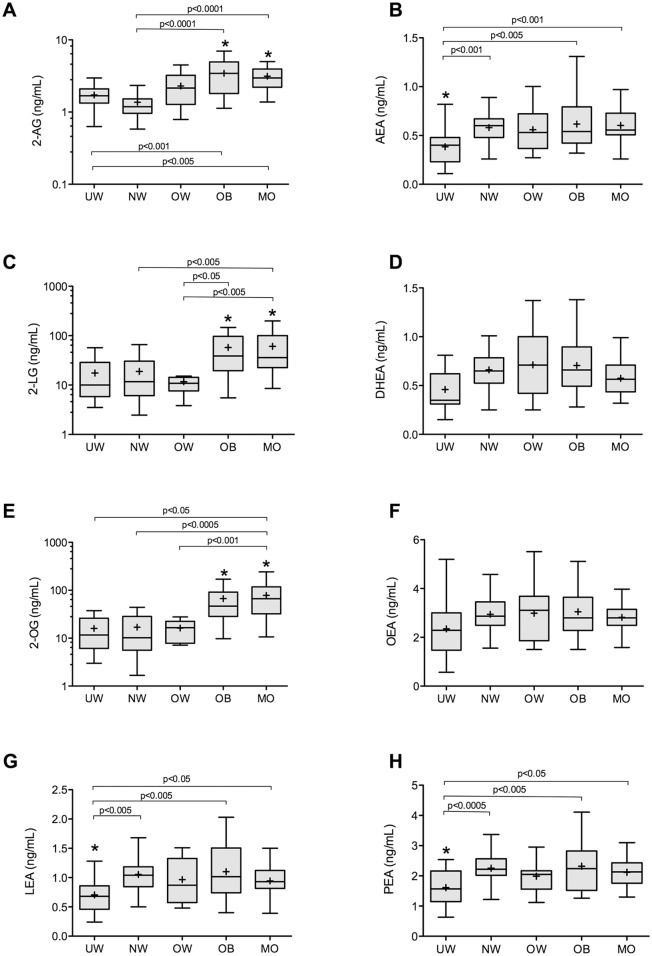
The endocannabinoid (eCB) system can promote food intake by increasing odor detection in mice. The eCB system is over-active in human obesity. Our aim is to measure circulating eCB concentrations and olfactory capacity in a human sample that includes people with obesity and explore the possible interaction between olfaction, obesity and the eCB system. The study sample was made up of 161 females with five groups of body mass index sub-categories ranging from under-weight to morbidly obese. We assessed olfactory capacity with the "Sniffin´Sticks" test, which measures olfactory threshold-discrimination-identification (TDI) capacity. We measured plasma concentrations of the eCBs 2-arachidonoylglycerol (2-AG) and N-arachidonoylethanolamine or anandamide (AEA), and several eCB-related compounds, 2-acylglycerols and N-acylethanolamines. 2-AG and other 2-acylglycerols fasting plasma circulating plasma concentrations were higher in obese and morbidly obese subjects. AEA and other N-acylethanolamine circulating concentrations were lower in under-weight subjects. Olfactory TDI scores were lower in obese and morbidly obese subjects. Lower TDI scores were independently associated with higher 2-AG fasting plasma circulating concentrations, higher %body fat, and higher body mass index, after controlling for age, smoking, menstruation, and use of contraceptives. Our results show that obese subjects have a lower olfactory capacity than non-obese ones and that elevated fasting plasma circulating 2-AG concentrations in obesity are linked to a lower olfactory capacity. In agreement with previous studies we show that eCBs AEA and 2-AG, and their respective congeners have a distinct profile in relation to body mass index. The present report is the first study in humans in which olfactory capacity and circulating eCB concentrations have been measured in the same subjects.
Conflict of interest statement
Figures

Similar articles
-
Impact of circadian rhythmicity and sleep restriction on circulating endocannabinoid (eCB) N-arachidonoylethanolamine (anandamide).Psychoneuroendocrinology. 2020 Jan;111:104471. doi: 10.1016/j.psyneuen.2019.104471. Epub 2019 Oct 4. Psychoneuroendocrinology. 2020. PMID: 31610409 Free PMC article.
-
Responses of peripheral endocannabinoids and endocannabinoid-related compounds to hedonic eating in obesity.Eur J Nutr. 2016 Jun;55(4):1799-805. doi: 10.1007/s00394-016-1153-9. Epub 2016 Jan 12. Eur J Nutr. 2016. PMID: 26759262
-
Circulating endocannabinoids in insulin sensitive vs. insulin resistant obese postmenopausal women. A MONET group study.Obesity (Silver Spring). 2014 Jan;22(1):211-6. doi: 10.1002/oby.20498. Epub 2013 Oct 19. Obesity (Silver Spring). 2014. PMID: 23616305
-
The circulating and central endocannabinoid system in obesity and weight loss.Int J Obes (Lond). 2024 Oct;48(10):1363-1382. doi: 10.1038/s41366-024-01553-z. Epub 2024 Jun 4. Int J Obes (Lond). 2024. PMID: 38834796 Review.
-
Changes in peripheral endocannabinoid levels in substance use disorders: a review of clinical evidence.Am J Drug Alcohol Abuse. 2025 Mar 4;51(2):152-164. doi: 10.1080/00952990.2025.2456499. Epub 2025 Apr 8. Am J Drug Alcohol Abuse. 2025. PMID: 40197861 Review.
Cited by
-
The association of dietary patterns with endocannabinoids levels in overweight and obese women.Lipids Health Dis. 2020 Jul 6;19(1):161. doi: 10.1186/s12944-020-01341-4. Lipids Health Dis. 2020. PMID: 32631352 Free PMC article.
-
Reduced Olfactory Bulb Volume in Obesity and Its Relation to Metabolic Health Status.Front Hum Neurosci. 2020 Nov 27;14:586998. doi: 10.3389/fnhum.2020.586998. eCollection 2020. Front Hum Neurosci. 2020. PMID: 33328935 Free PMC article.
-
Brain Imaging of Taste Perception in Obesity: a Review.Curr Nutr Rep. 2019 Jun;8(2):108-119. doi: 10.1007/s13668-019-0269-y. Curr Nutr Rep. 2019. PMID: 30945140 Free PMC article. Review.
-
Application of Artificial Neural Networks (ANN) to Elucidate the Connections among Smell, Obesity with Related Metabolic Alterations, and Eating Habit in Patients with Weight Excess.Metabolites. 2023 Jan 30;13(2):206. doi: 10.3390/metabo13020206. Metabolites. 2023. PMID: 36837824 Free PMC article.
-
The association between olfactory dysfunction and cardiovascular disease and its risk factors in middle-aged and older adults.Sci Rep. 2021 Jan 13;11(1):1248. doi: 10.1038/s41598-020-80943-5. Sci Rep. 2021. PMID: 33441955 Free PMC article. Clinical Trial.
