. 2016 Feb 4;18(2):189-202.
doi: 10.1016/j.stem.2016.01.006.

A miR-34a-Numb Feedforward Loop Triggered by Inflammation Regulates Asymmetric Stem Cell Division in Intestine and Colon Cancer

Affiliations

A miR-34a-Numb Feedforward Loop Triggered by Inflammation Regulates Asymmetric Stem Cell Division in Intestine and Colon Cancer

Pengcheng Bu et al. Cell Stem Cell. .

Abstract

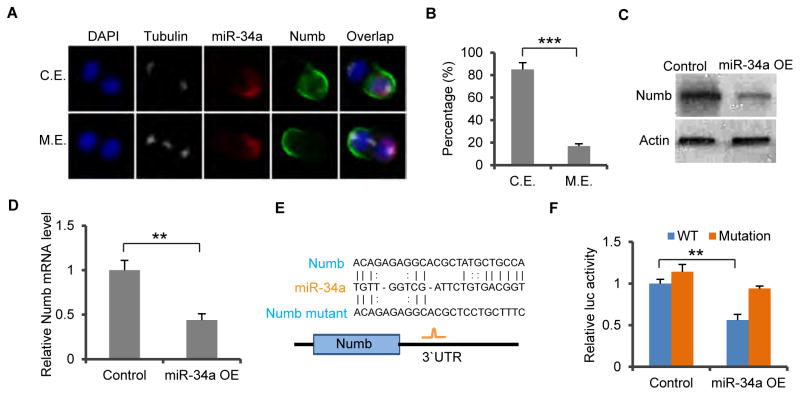
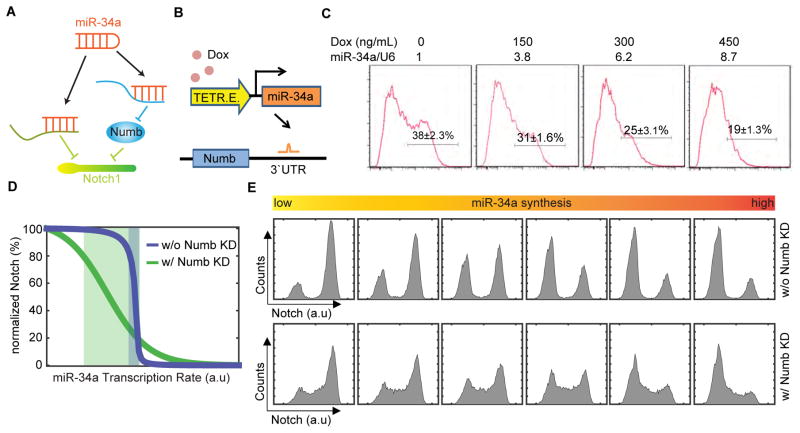
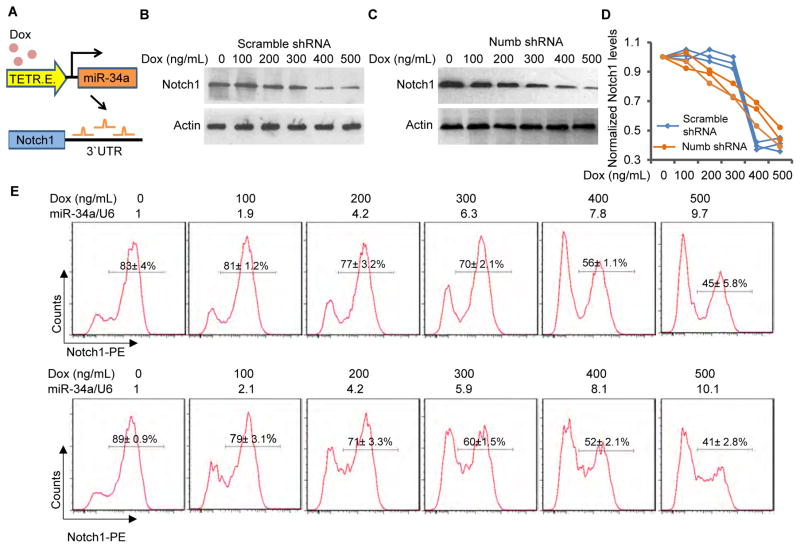
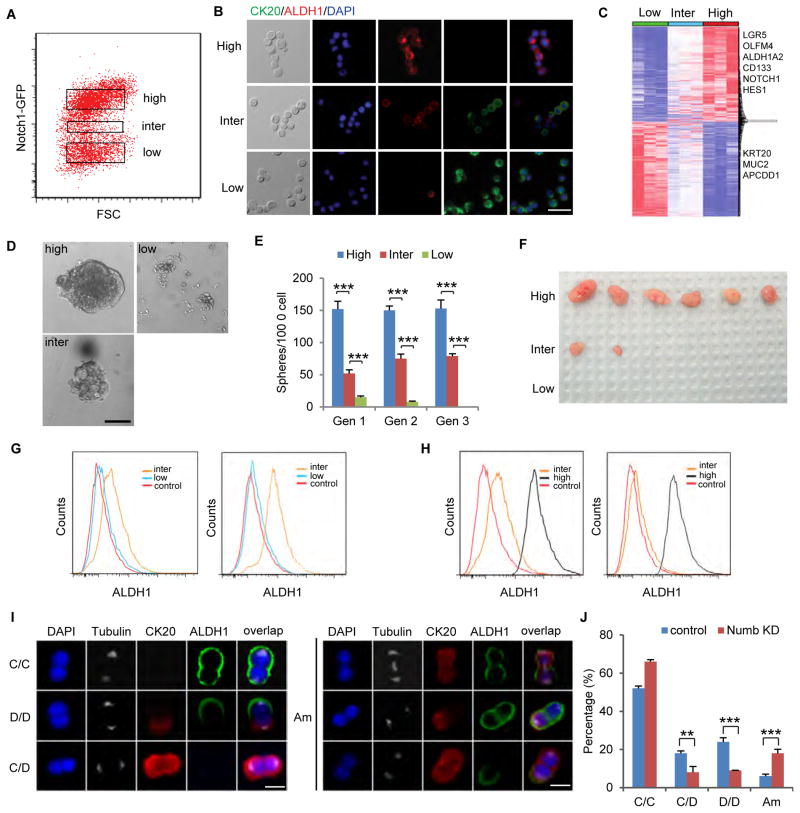
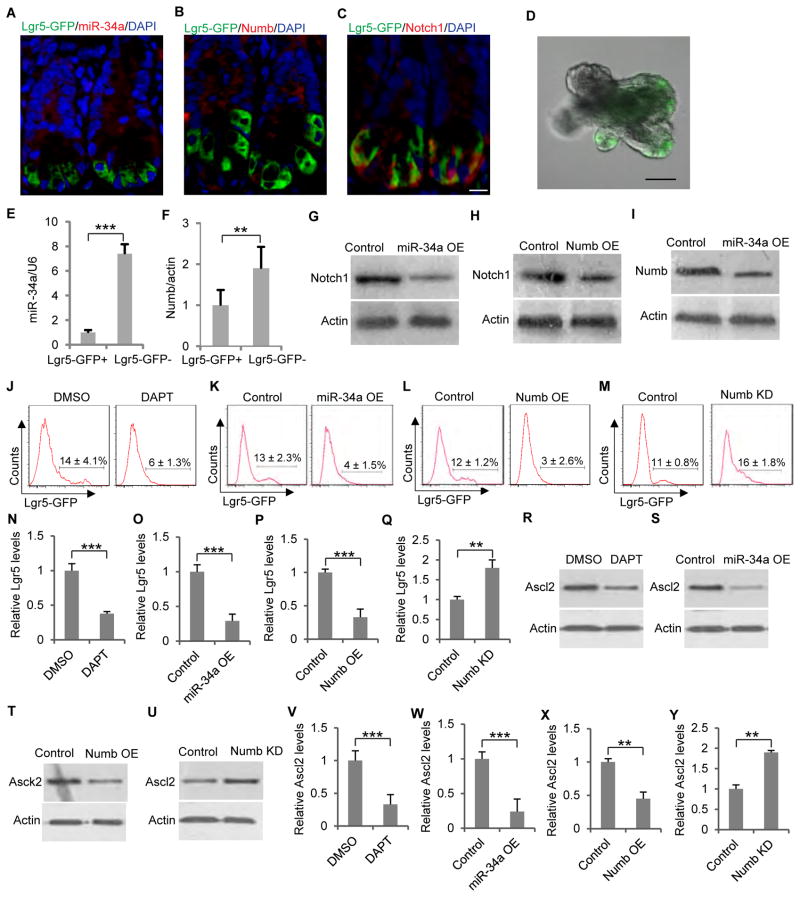
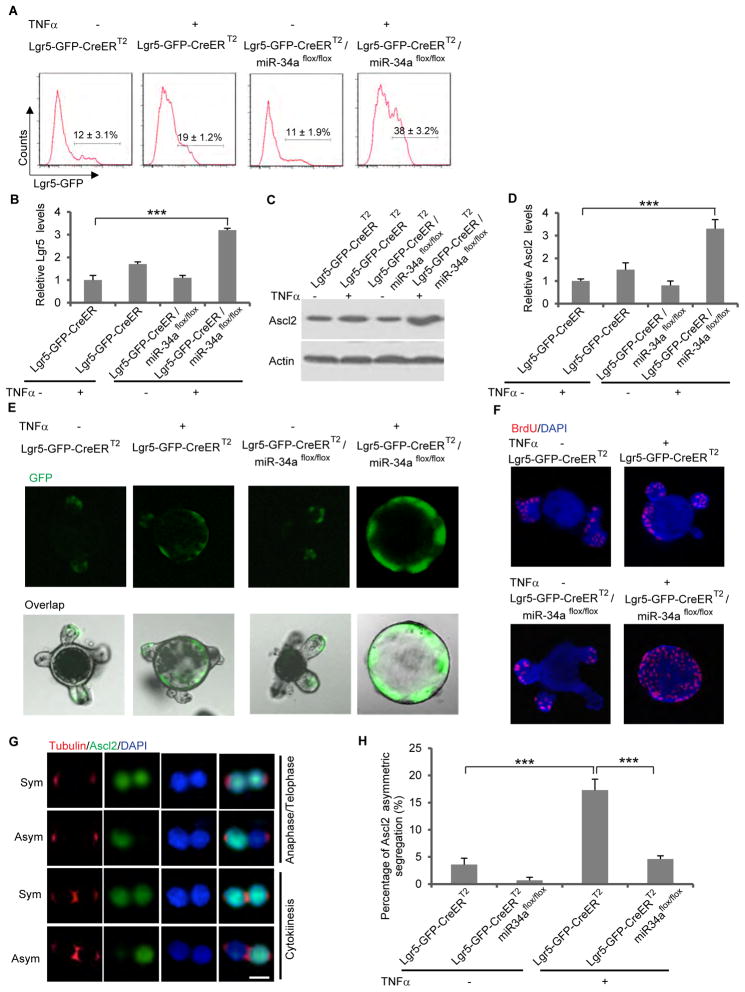
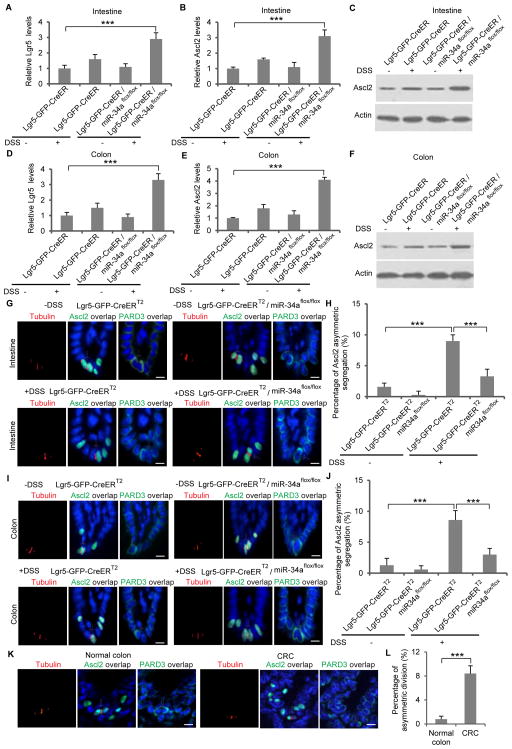
Emerging evidence suggests that microRNAs can initiate asymmetric division, but whether microRNA and protein cell fate determinants coordinate with each other remains unclear. Here, we show that miR-34a directly suppresses Numb in early-stage colon cancer stem cells (CCSCs), forming an incoherent feedforward loop (IFFL) targeting Notch to separate stem and non-stem cell fates robustly. Perturbation of the IFFL leads to a new intermediate cell population with plastic and ambiguous identity. Lgr5+ mouse intestinal/colon stem cells (ISCs) predominantly undergo symmetric division but turn on asymmetric division to curb the number of ISCs when proinflammatory response causes excessive proliferation. Deletion of miR-34a inhibits asymmetric division and exacerbates Lgr5+ ISC proliferation under such stress. Collectively, our data indicate that microRNA and protein cell fate determinants coordinate to enhance robustness of cell fate decision, and they provide a safeguard mechanism against stem cell proliferation induced by inflammation or oncogenic mutation.


Figures

Figure 1
Figure 1. miR-34a directly targets Numb
(A) Representative images of miR-34a (RNA FISH, red) and Numb (green) distribution during CCSC division. mir-34a and Numb can co-exist (C.E., top row) or be mutually exclusive (M.E., bottom row) in daughter cells. (B) Percentages of CCSC divisions wherein miR-34a and Numb are M.E. or C.E. (C and D) Western blot (C) and RT-qPCR (D) of Numb levels showing ectopic miR-34a expression (miR-34a OE) suppresses Numb expression compared to the control vector. (E) Schematic illustration of predicted binding between miR-34a and Numb 3′ UTR, and mutation introduced to the seed region. (F) Luciferase reporter assay confirming the miR-34a binding site in Numb 3′UTR. Numb 3′UTR sequences containing the wild-type (Wt) or mutated (Mut) putative miR-34a binding sites were cloned into the 3′UTR of firefly luciferase (Fluc). Fluc signals were normalized by Renillar luciferase (Rluc) signals. Mutation of the binding site attenuated suppression of Numb by ectopic miR-34a expression (miR-34a OE). Scale bar, 8μm. Error bars denote s.d. of triplicates. **, p<0.01; ***, p<0.001. p-value was calculated based on Student’s t-test. Also see Figure S1.
Figure 2
Figure 2. Computational analysis of the incoherent feedforward loop (IFFL)
(A) Schematic of the IFFL formed by miR-34a, Numb, and Notch1. (B) Schematic illustration of the inducible miR-34a construct used in the experiment shown in (C). (C) FACS analysis of Numb expression in CCSC sphere cells when miR-34a expression was incrementally induced by Doxycycline. (D) Simulated Notch1 vs. miR-34a levels from the ODE-based IFFL and Numb knockdown models. Shaded areas are transition regions (80% to 20% of peak Notch level). (E) Simulated Notch1 distributions with IFFL and Numb knockdown models. Also see Figure S2.
Figure 3
Figure 3. IFFL generates a robust Notch switch
(A) Schematic illustration of the inducible miR-34a construct used in the experiments shown in (B to E). (B and C) Western blots of Notch levels in scramble shRNA (B) and Numb shRNA (C) infected CCSC spheres with incremental mir-34a induction by Doxycycline. (D) Quantification of Western blots in three independent repeats. (E) FACS analysis of Notch1 bimodality with incremental miR-34a induction by Doxycycline. Top row, intact IFFL; bottom row, Numb knockdown. miR-34a levels were measured by RT-qPCR and shown on top of the FACs plots. Also see Figure S2.
Figure 4
Figure 4. Numb knockdown gives rise to an intermediate population
(A) FACS plot showing Notchhigh, Notchinter, and Notchlow subpopulations of Numb knockdown sphere cells, treated with 200ng/ml Doxycycline. (B) Immunofluorescence of Notchhigh, Notchinter, and Notchlow cells for CK20 (green) and ALDH1 (red). Scale bar, 20μm. (C) Heat-map of transcriptomes of Notchhigh, Notchinter, and Notchlow cells measured by RNA-seq. (D) Representative images of spheres grown from Notchhigh, Notchinter, and Notchlow cells. Scale bar, 50μm. (E) Serial Sphere propagation of Notchhigh, Notchinter, and Notchlow cells isolated from Numb knockdown sphere cells. Gen, generation. (F) Tumor images showing tumorigenic capability of transplanted Notchhigh, Notchinter, and Notchlow cells. (G) FACS analysis of Notchinter and Notchlow cells before (left) and after (right) being under stem cell culture condition for 7 days. Notchinter cells turned on ALDH1 expression under stem cell culture condition, whereas Notchlow cells did not. (H) FACS analysis of Notchinter and Notchhigh cells before (left) and after (right) being in FBS-containing medium for 24 hours. Notchinter cells lost ALDH1 expression, whereas Notchhigh cells did not. (I) Representative immunofluorescence images for ALDH1 (red) and CK20 (green) illustrating four types of division: CCSC/CCSC (C/C), CCSC/non-CCSC (C/D), non-CCSC/non-CCSC (D/D) and ambiguous (Am). Scale bar, 8μm. (J) Numb knockdown significantly increased Am divisions besides reducing C/D and D/D. Error bars denote s.d. of triplicates. **, p<0.01; ***, p<0.001. p-value was calculated based on Student’s t-test. Also see Figure S3.
Figure 5
Figure 5. miR-34a and Numb expression in mouse intestinal cells
(A to C) Immunofluorescence images of intestinal crypts from an Lgr5-EGFP-CreERT2 transgenic mouse. Scale bar, 20μm. (D) A representative image of an intestinal organoid with Lgr5-GFP labeled ISCs. Scale bar, 50μm. (E and F) miR-34a (E) and Numb (F) expression levels in Lgr5-GFP+ and Lgr5-GFP− cells isolated from Lgr5-EGFP-CreERT2 intestinal organoids, measured by RT-qPCR. (G and H) Western blot showing that ectopic miR-34a (G) or Numb (H) expression decreased Notch1 level in organoid cells. (I) Western blot showing that ectopic miR-34a expression decreased Numb level in organoid cells. (J) DAPT treatment decreased the Lgr5-GFP cell population in Lgr5-EGFP-CreERT2 organoids. (K and L) Ectopic miR-34a (K) or Numb (L) expression decreased the Lgr5-GFP cell population in Lgr5-EGFP-CreERT2 organoids. (M) Numb knockdown gave rise to a subpopulation with intermediate Lgr5-GFP expression. (N to Q) RT-qPCR showing Lgr5 levels in conditions corresponding to J to M. (R to U) Western blot showing Ascl2 levels in conditions corresponding to J to M. (V to Y) RT-qPCR showing Ascl2 levels in conditions corresponding to J to M. Error bars denote s.d. of triplicates. **, p<0.01; ***, p<0.001. p-value was calculated based on Student’s t-test. Also see Figure S4.
Figure 6
Figure 6. Loss of miR-34a inhibits asymmetric division and promotes ISC proliferation in organoids treated with TNFα
(A) FACS analysis of Lgr5-EGFP-CreERT2 and Lgr5-EGFP-CreERT2/miR-34aflox/flox organoids with or without TNFα treatment. Percentage of Lgr5-GFP ISCs increased more dramatically in organoids from Lgr5-EGFP-CreERT2/miR-34aflox/flox mice. (B) RT-qPCR showing Lgr5 levels. (C and D) RT-qPCR (C) and Western blot (D) showing Ascl2 levels. (E) Representative images of organoids. Intestinal organoids from Lgr5-EGFP-CreERT2/miR-34aflox/flox mice grew into CCSC-like, undifferentiated spheres with high level of Lgr5-GPF upon TNFα treatment. (F) Cell proliferation measured by BrdU incorporation. (G and H) Representative images (G) and quantification (H) of symmetric and asymmetric division of Ascl2+ ISCs in Lgr5-EGFP-CreERT2 and Lgr5-EGFP-CreERT2/miR-34aflox/flox intestinal organoids with or without TNFα treatment. Tubulin staining indicates stages of mitosis. The anaphase/telophase images were taken from FACS-sorted doublets that were fixed and stained immediately without recovery. The cytokinesis images were taken from the pair-cell assay. Scale bar, 8μm. Error bars denote s.d. of triplicates. ***, p<0.001. p-value was calculated based on Student’s t-test. Also see Figure S4 and Figure S7.
Figure 7
Figure 7. Loss of miR-34a inhibits asymmetric division and promotes ISC proliferation in crypts recovering from DSS treatment
(A) RT-qPCR showing Lgr5 levels in mouse intestine. (B and C) RT-qPCR (B) and Western blot (C) showing Ascl2 levels in mouse intestine. (D) RT-qPCR showing Lgr5 levels in mouse colon. (E and F) RT-qPCR (E) and Western blot (F) showing Ascl2 levels in mouse colon. (G and H) Representative images (G) and quantification (H) of symmetric and asymmetric division of Ascl2+ intestinal stem cells in Lgr5-EGFP-CreERT2 and Lgr5-EGFP-CreERT2/miR-34aflox/flox mice with (+DSS) or without (-DSS) treatment. Cell polarity protein PARD3 was also stained. (I and J) Representative images (I) and quantification (J) of symmetric and asymmetric division of Ascl2+ colon stem cells in Lgr5-EGFP-CreERT2 and Lgr5-EGFP-CreERT2/miR-34aflox/flox mice with (+DSS) or without (-DSS) treatment. PARD3 established cell polarity. (K and L) Representative images (I) and quantification (J) of symmetric and asymmetric division of Ascl2+ cells in human normal colon and CRC tissue. Scale bar, 20μm. Error bars denote s.d. of triplicates. ***, p<0.001. p-value was calculated based on Student’s t-test. Also see Figures S5–S7.

Comment in

Similar articles

Cited by

References

    1. Bader AG. miR-34 - a microRNA replacement therapy is headed to the clinic. Frontiers in genetics. 2012;3:120. - PMC - PubMed
    1. Bajaj J, Zimdahl B, Reya T. Fearful Symmetry: Subversion of Asymmetric Division in Cancer Development and Progression. Cancer research. 2015;75:792–797. - PMC - PubMed
    1. Beckmann J, Scheitza S, Wernet P, Fischer JC, Giebel B. Asymmetric cell division within the human hematopoietic stem and progenitor cell compartment: identification of asymmetrically segregating proteins. Blood. 2007;109:5494–5501. - PubMed
    1. Boon RA, Iekushi K, Lechner S, Seeger T, Fischer A, Heydt S, Kaluza D, Treguer K, Carmona G, Bonauer A, et al. MicroRNA-34a regulates cardiac ageing and function. Nature. 2013;495:107–110. - PubMed
    1. Bouchie A. First microRNA mimic enters clinic. Nature biotechnology. 2013;31:577. - PubMed

Publication types

MeSH terms