. 2016 Jul;10(7):1731-41.
doi: 10.1038/ismej.2015.230. Epub 2016 Feb 5.

Contributions of ancestral inter-species recombination to the genetic diversity of extant Streptomyces lineages

Affiliations

Contributions of ancestral inter-species recombination to the genetic diversity of extant Streptomyces lineages

Cheryl P Andam et al. ISME J. 2016 Jul.

Abstract

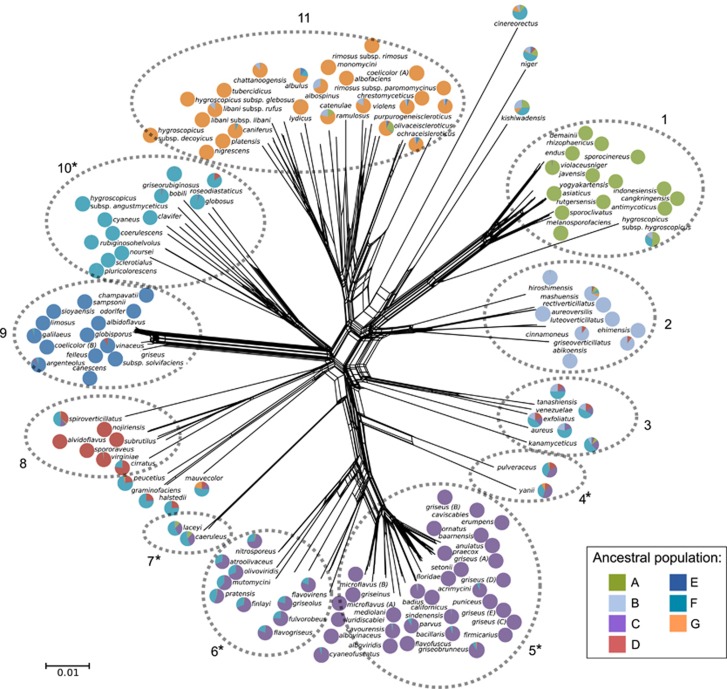
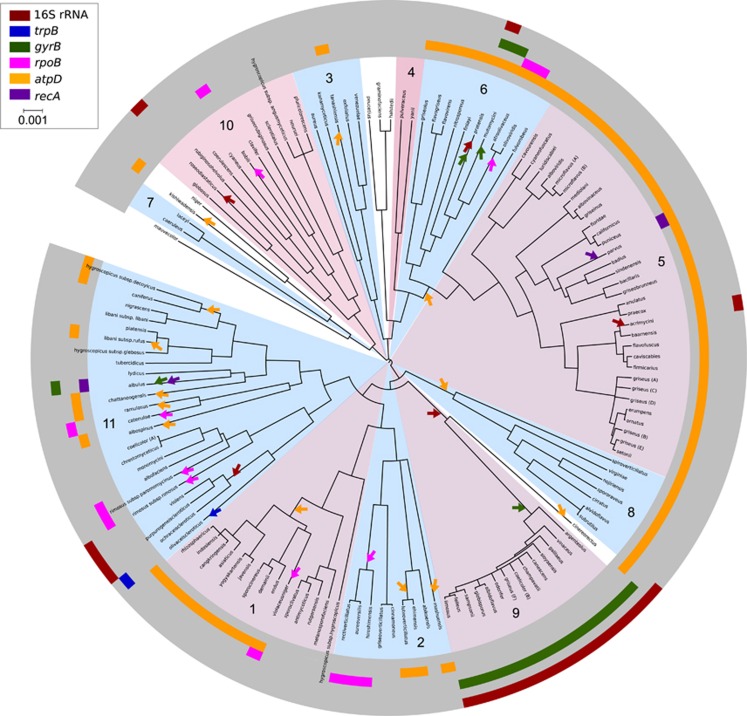
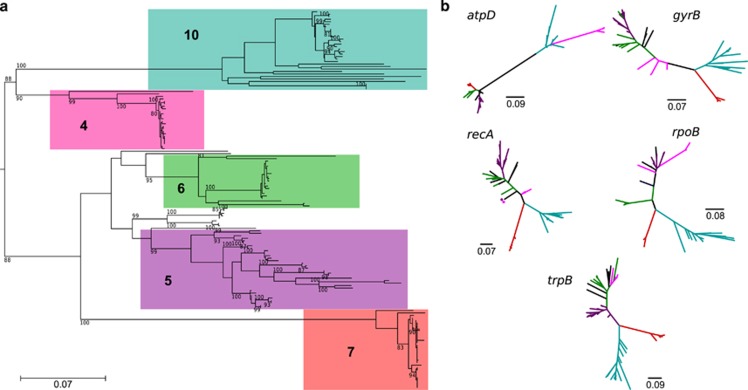
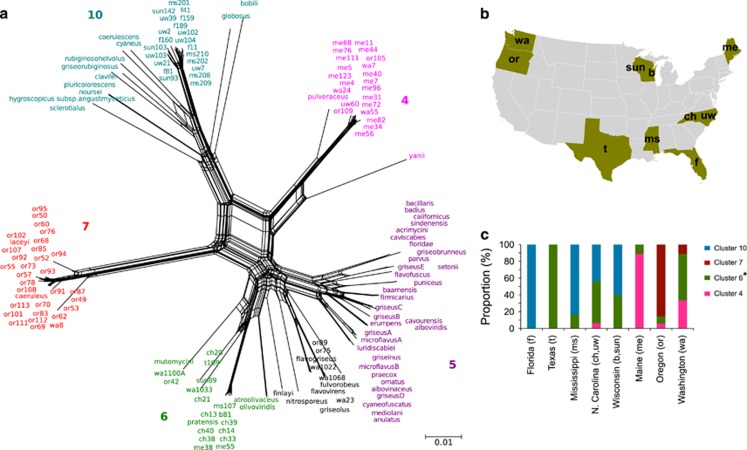
Streptomyces species produce many important antibiotics and have a crucial role in soil nutrient cycling. However, their evolutionary history remains poorly characterized. We have evaluated the impact of homologous recombination on the evolution of Streptomyces using multi-locus sequence analysis of 234 strains that represent at least 11 species clusters. Evidence of inter-species recombination is widespread but not uniform within the genus and levels of mosaicism vary between species clusters. Most phylogenetically incongruent loci are monophyletic at the scale of species clusters and their subclades, suggesting that these recombination events occurred in shared ancestral lineages. Further investigation of two mosaic species clusters suggests that genes acquired by inter-species recombination may have become fixed in these lineages during periods of demographic expansion; implicating a role for phylogeography in determining contemporary patterns of genetic diversity. Only by examining the phylogeny at the scale of the genus is apparent that widespread phylogenetically incongruent loci in Streptomyces are derived from a far smaller number of ancestral inter-species recombination events.


Figures

Figure 1
Figure 1
A phylogenetic network for Streptomyces generated using SplitsTree with default settings. The network was built using concatenated sequences of 16S rRNA, trpB, atpD, gyrB, rpoB and recA loci. The pie charts associated with each species show the ancestry of each species, with each color representing the seven ancestral lineages inferred by Structure. The dotted circles highlight distinct clusters. Asterisks indicate clusters targeted for further analysis including those with high (4 and 6) and low (5 and 10) admixture. Admixed clusters 4, 6 and 7 have genetic contributions from clusters 5 and 10. Scale bar indicates 0.01 substitutions per site.
Figure 2
Figure 2
Clonal phylogeny for Streptomyces generated using ClonalFrame (50% consensus tree). Numbers and alternating blue and pink colors in the middle of the tree correspond to species clusters from Figure 1. Arrows indicate HR events at nodes of the tree as inferred by RDP and their position relative to the length of each branch is arbitrary. Colored bars in the outer rings indicate genes that are affected by HR as determined by RDP analysis. The loci inferred to be acquired by HR are identified by color as indicated in the scale. The scale bar in the ClonalFrame genealogy represents time in coalescent units.
Figure 3
Figure 3
Maximum likelihood phylogeny of species clusters 4, 5, 6, 7 and 10, with the addition of isolates collected from diverse geographic sites (n=152). (a) Phylogeny calculated from the concatenated alignment of the five housekeeping genes trpB, gyrB, rpoB, atpD and recA (see Supplementary Figure S3 for names of taxa). Only bootstrap values ⩾50% are shown. (b) Individual gene trees for each of the five genes (see Supplementary Figure S3 for names of taxa). Taxa labeled in black indicate ambiguous cluster membership. Scale bars indicate substitutions per site.
Figure 4
Figure 4
Evolutionary relationships and geographic sources of isolates from the second data set, consisting of species clusters 4, 5, 6, 7 and 10. (a) SplitsTree network of the five selected clusters, genetic relationships were calculated from the concatenated alignment of the five housekeeping genes trpB, gyrB, rpoB, atpD and recA. Colors correspond with Figure 3. Taxa labeled in black indicate ambiguous cluster membership from Figure 3. Scale bar indicates 0.01 substitutions per site. (b) Location of sites from which strains were isolated (see also Supplementary Table S2). The labels for each site correspond to the sampling names used for the isolates. (c) Distribution of the five clusters in each state in the United States. Colors of the bars correspond to those found in panel a. Cluster 6 consists of isolates labeled in green and black in the SplitsTree.

Similar articles

Cited by

References

    1. Alacevic M. (1963). Interspecific recombination in Streptomyces. Nature 197: 1323. - PubMed
    1. Altschul SF, Gish W, Miller W, Myers EW, Lipman DJ. (1990). Basic local alignment search tool. J Mol Biol 215: 403–410. - PubMed
    1. Alvarez-Pérez S, de Vega C, Herrera CM. (2013). Multilocus sequence analysis of nectar pseudomonads reveals high genetic diversity and contrasting recombination patterns. PloS One 8: e75797. - PMC - PubMed
    1. Bapteste E, Boucher Y. (2009). Epistemological impacts of horizontal gene transfer on classification in microbiology. Methods Mol Biol Clifton NJ 532: 55–72. - PubMed
    1. Barilani M, Bernard-Laurent A, Mucci N, Tabarroni C, Kark S, Perez Garrido JA et al. (2007). Hybridisation with introduced chukars (Alectoris chukar threatens the gene pool integrity of native rock (A. graeca and red-legged (A. rufa partridge populations. Biol Cons 137: 57–69.