Comparative Study
. 2016 Feb 5;11(2):e0148253.
doi: 10.1371/journal.pone.0148253. eCollection 2016.

Differences in Looking at Own- and Other-Race Faces Are Subtle and Analysis-Dependent: An Account of Discrepant Reports

Affiliations
Comparative Study

Differences in Looking at Own- and Other-Race Faces Are Subtle and Analysis-Dependent: An Account of Discrepant Reports

Joseph Arizpe et al. PLoS One. .

Abstract

The Other-Race Effect (ORE) is the robust and well-established finding that people are generally poorer at facial recognition of individuals of another race than of their own race. Over the past four decades, much research has focused on the ORE because understanding this phenomenon is expected to elucidate fundamental face processing mechanisms and the influence of experience on such mechanisms. Several recent studies of the ORE in which the eye-movements of participants viewing own- and other-race faces were tracked have, however, reported highly conflicting results regarding the presence or absence of differential patterns of eye-movements to own- versus other-race faces. This discrepancy, of course, leads to conflicting theoretical interpretations of the perceptual basis for the ORE. Here we investigate fixation patterns to own- versus other-race (African and Chinese) faces for Caucasian participants using different analysis methods. While we detect statistically significant, though subtle, differences in fixation pattern using an Area of Interest (AOI) approach, we fail to detect significant differences when applying a spatial density map approach. Though there were no significant differences in the spatial density maps, the qualitative patterns matched the results from the AOI analyses reflecting how, in certain contexts, Area of Interest (AOI) analyses can be more sensitive in detecting the differential fixation patterns than spatial density analyses, due to spatial pooling of data with AOIs. AOI analyses, however, also come with the limitation of requiring a priori specification. These findings provide evidence that the conflicting reports in the prior literature may be at least partially accounted for by the differences in the statistical sensitivity associated with the different analysis methods employed across studies. Overall, our results suggest that detection of differences in eye-movement patterns can be analysis-dependent and rests on the assumptions inherent in the given analysis.


Conflict of interest statement

Competing Interests: The authors have declared that no competing interests exist.

Figures

Fig 1
Fig 1. Study design.
(a) Four example face stimuli. (b) AOIs for one face showing the calculation of start positions, which were determined separately for each face and defined relative to that face. Green dots schematically illustrate the potential start positions relative to the upcoming face. Left and right start positions were equidistant from centers of the nearest eye, nose and mouth AOIs. Upper and lower start positions were equidistant from the centers of the two eye or two mouth AOIs, respectively. Dotted blue lines schematically illustrate that the start positions were equidistant from the centers of the indicated AOIs. (c) Trial sequences in study and test phases. A face was only presented if the participant successfully maintained fixation for a total of 1.5 seconds. After face onset in the study phase, participants were free to study the face for up to 10 seconds and pressed a button to begin the next trial. In the test phase, faces were presented for one second only and participants responded with button presses to indicate whether the face was ‘old’ or ‘new’.
Fig 2
Fig 2. Effects of race of face on recognition performance.
(a) Face recognition performance, measured by d’, was significantly lower for Chinese compared to Caucasian and African faces. (b) Criterion scores for Caucasian faces were higher (stricter) than African and Chinese faces. Also criterion scores for African faces were higher than for Chinese faces. (c) Reaction times did not differ among different race faces. Error bars indicate the between-subjects standard error.
Fig 3
Fig 3. Distribution of fixations across AOIs for own- and other-race faces during the study phase.
(a) Relative frequencies of fixations for each race of face across AOIs for the second through fifth fixations pooled. Error bars indicate between-subject standard errors. (b) Within-subject differences among race of face conditions from (a) reveal significantly more eye fixations for Caucasian than Chinese faces, significantly fewer nose fixations for own- than other-race faces, and significantly fewer mouth fixations for Caucasian than African faces. Error bars indicate the within-subject standard error.
Fig 4
Fig 4. Spatial density of fixations for Caucasian, African, and Chinese faces during the study phase.
The faces plotted beneath the spatial density plots are the average of all faces of the given race after alignment. Fixations are plotted as Gaussian densities summed across trials and participants. Fixation density is indicated using a color scale from zero to the maximum density value observed, with zero being transparent.
Fig 5
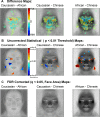
Fig 5. Spatial density contrast maps.
(a) Spatial density difference maps showing numerically greater fixation density over the eyes and numerically lesser fixation density over the nose and mouth of own- than other-race faces. (b) Statistical maps thresholded at p < 0.01, uncorrected, suggesting fine differences in fixation density for the features of own- and other-races faces and also evidence of greater diffusivity of the spatial extent of fixation patterns for other- compared to own-race faces. (c) The same statistical maps from (b) FDR corrected at q < 0.05 reveal that no differences survive the correction.
Fig 6
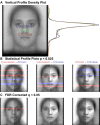
Fig 6. Vertical profile density plots and profile contrast plots.
(a) Vertical profile densities for Caucasian, African, and Chinese faces suggesting numerically greater fixations density over the eyes and numerically lesser fixation density over the mouth for own- than other-race faces. (b) Statistical profile plots thresholded at p < 0.025, uncorrected, suggesting significantly greater fixation density over the eyes and numerically lesser fixation density over the mouth for own- than other-race faces. (c) The same statistical profile plots from (b) FDR corrected at q < 0.05 reveal that a relatively greater fixation density over the eyes for Caucasian than African faces survives the correction.

References

    1. Henderson JM, Williams CC, Falk RJ. Eye movements are functional during face learning. Mem Cognit. 2005;33: 98–106. 10.3758/BF03195300 - DOI - PubMed
    1. Kealey R, Sekuler AB, Bennett PJ. Effects of viewing condition and age on the functionality of eye movements for face recognition memory. J Vis. 2008;8: 892–892. 10.1167/8.6.892 - DOI
    1. Malpass RS, Kravitz J. Recognition for faces of own and other race. J Pers Soc Psychol. 1969;13: 330–334. 10.1037/h0028434 - DOI - PubMed
    1. Cross JF, Cross J, Daly J. Sex, race, age, and beauty as factors in recognition of faces. Percept Psychophys. 1971;10: 393–396. 10.3758/BF03210319 - DOI
    1. Shepherd JW, Deregowski JB, Ellis HD. A Cross-Cultural Study of Recognition Memory For Faces. Int J Psychol. 1974;9: 205–212. 10.1080/00207597408247104 - DOI

Publication types

LinkOut - more resources