

doi: 10.1038/nbt.3474.
Precision and robustness of 2D-NMR for structure assessment of filgrastim biosimilars
Affiliations
- PMID: 26849514
- PMCID: PMC5218811
- DOI: 10.1038/nbt.3474
Item in Clipboard
Precision and robustness of 2D-NMR for structure assessment of filgrastim biosimilars
Nat Biotechnol.
2016 Feb.
No abstract available
Figures
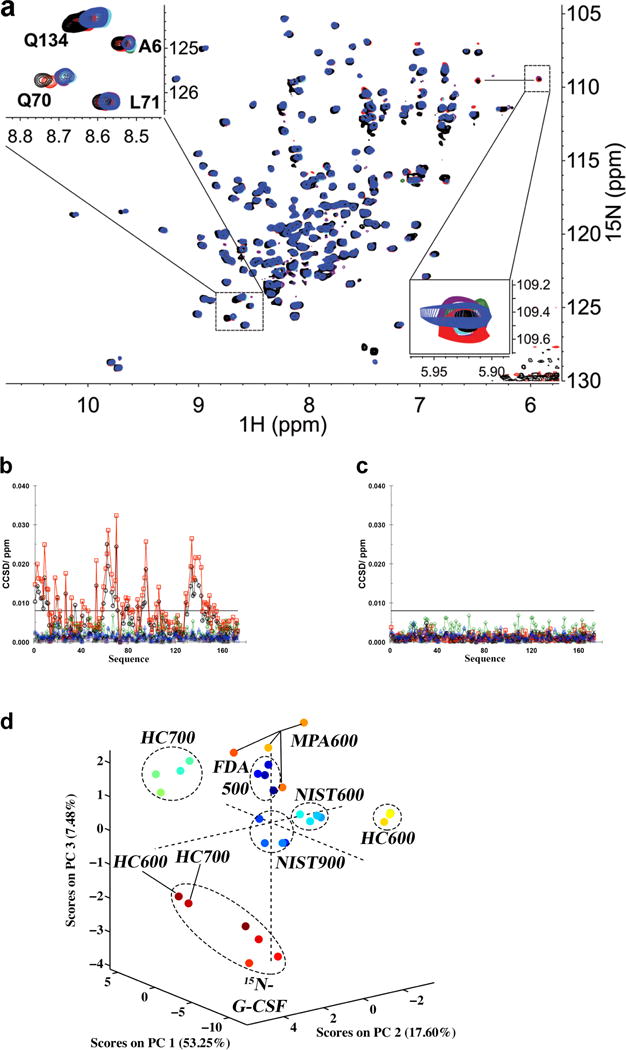
Spectral and Statistical Comparisons of NMR data. (a) Overlay plot of the same region on the same sample from Amgen at four fields and six instruments: NIST 900 (purple), NIST 600 (cyan), HC 700 (black), HC 600 (red), FDA 500 (green) and MPA 600 MHz (blue). Note that all resonances except data from HC 700 and HC 600 are perfectly overlaid under the blue peaks. This is highlighted in the upper left side inset showing an expansion of the regions containing signals from the amides of Q134, Q70, L71 and L6. In the lower right side inset, a weaker peak is plotted using different contours to show that it is observed in all spectra. Additional peaks in the lower right corner of the spectra arise from unsuppressed residual signal from H2O in some spectra. (b) An example of the combined chemical shift difference (CCSD) plots for the system suitability sample, 15N-met-G-CSF, as a function of sequence (NIST 900 (plus), NIST 600 (star), HC 700 (circle), HC 600 (square), FDA 500 (diamond) and MPA 600 (triangle)) with the sample temperature difference on the HC instruments (Extended Data). (c) Same as ‘b’ after temperature calibration. The reference chemical shift was based on average shift from NIST, FDA and MPA. The horizontal bar indicates the measured experimental precision limit of 8 ppb (Extended Data). (d) A plot of the result of the principal component analysis performed on data of the 4 drug products recorded at the 4 laboratories on six instruments, FDA 500 (dark blue); NIST 900 (blue, the cluster at ORIGIN); NIST 600 (turquoise); HC 700 (green); HC 600 (yellow); MPA 600 (orange) (Extended Data). Dashed ellipses show the relative clustering of data from each laboratory. For this panel, the temperatures during collection of HC 600 and HC 700 data were not calibrated.
References
-
- Health Canada. GUIDANCE FOR SPONSORS: Information and Submission Requirements for Subsequent Entry Biologics (SEBs) Health Canada -Publications. 2010;17 2010/03/05.
-
- EMEA Comparability of biotechnological/biological products subject to changes in their manufacturing process. CPMP/ICH/5721/03. 2006;13
-
- US FDA. Guidance for Industry: Quality Considerations in Demonstrating Biosimilarity to a Reference Protein Product. Office of Communications US FDA. 2012:1–20. UCM291134.
-
- US FDA. Guidance for Industry: Scientific Considerations in Demonstrating Biosimilarity to a Reference Produc. Office of Communications US FDA. 2012:1–25. UCM291128.
-
- Gabrielson JP, Weiss WF. 4th Technical decision-making with higher order structure data: starting a new dialogue. J Pharm Sci. 2015;104:1240–1245. - PubMed
Publication types
MeSH terms
Substances
Grants and funding
LinkOut - more resources
Full Text Sources
Other Literature Sources
