. 2016 Apr:93:145-54.
doi: 10.1016/j.freeradbiomed.2016.02.003. Epub 2016 Feb 2.

Persister formation in Escherichia coli can be inhibited by treatment with nitric oxide

Affiliations

Persister formation in Escherichia coli can be inhibited by treatment with nitric oxide

Mehmet A Orman et al. Free Radic Biol Med. 2016 Apr.

Abstract

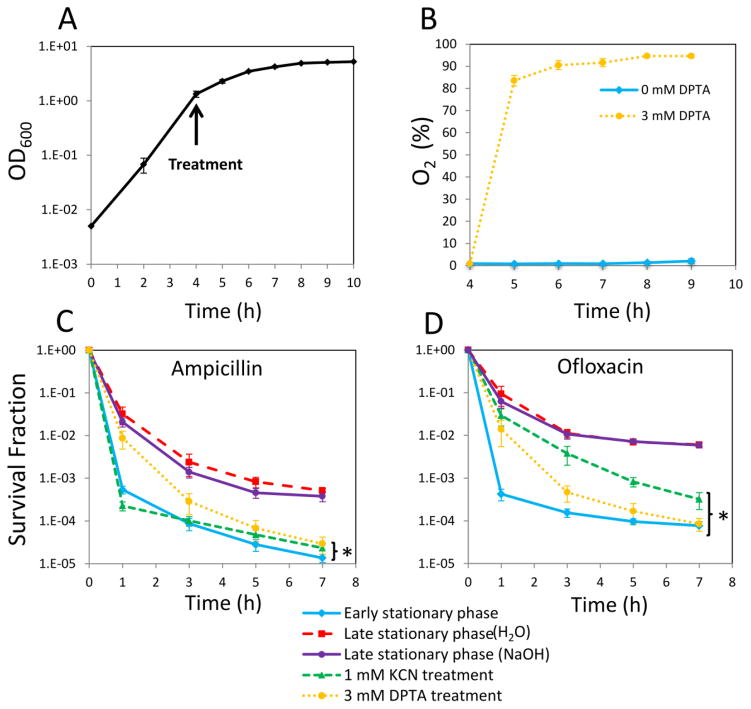
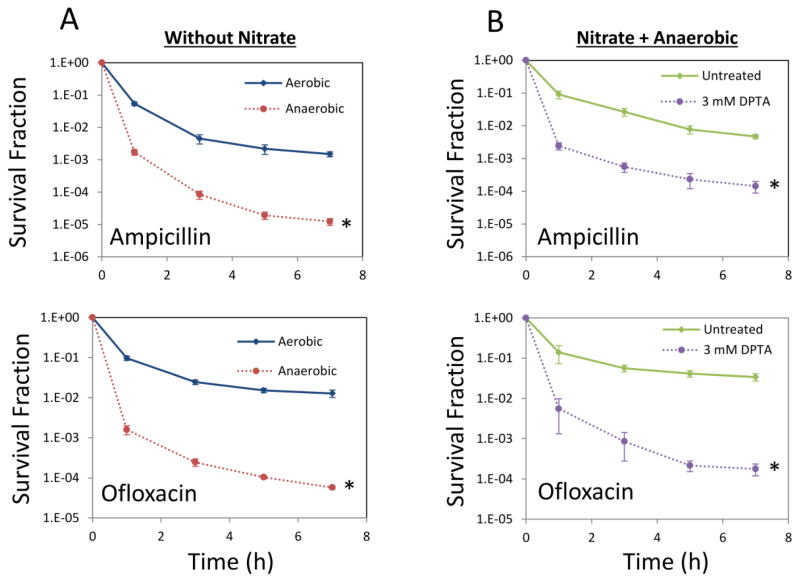
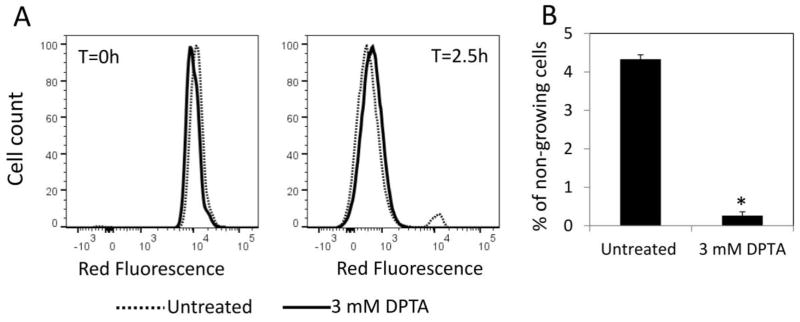
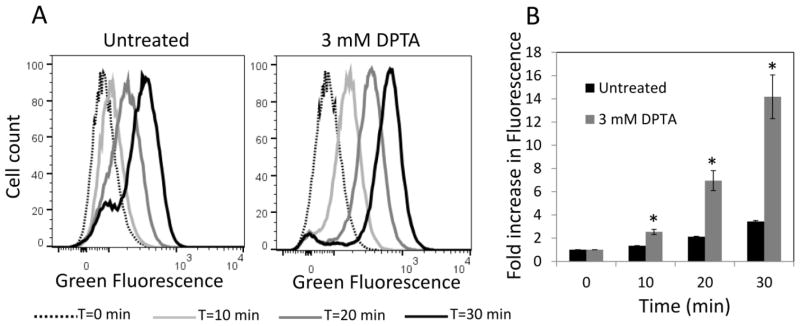
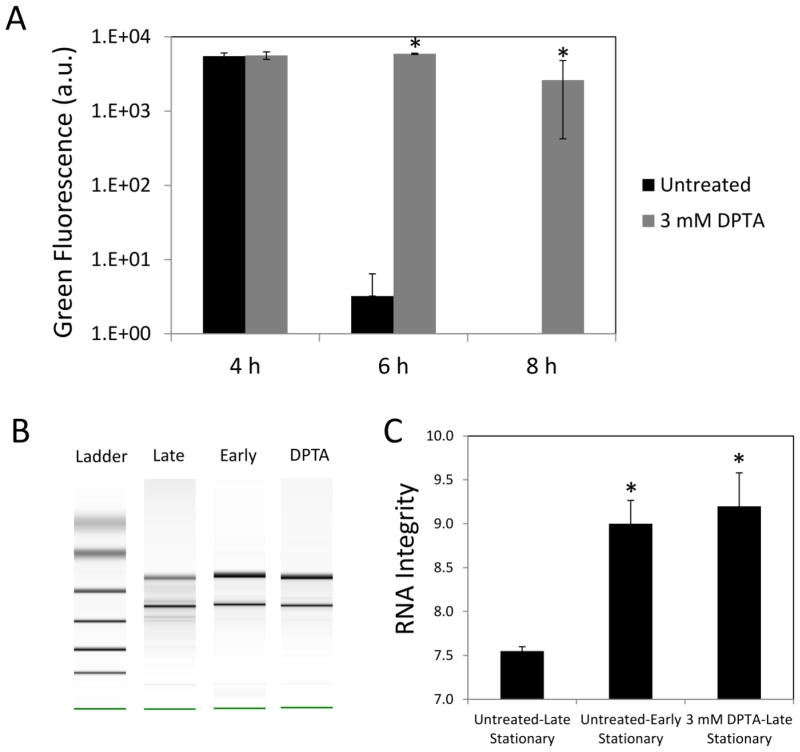
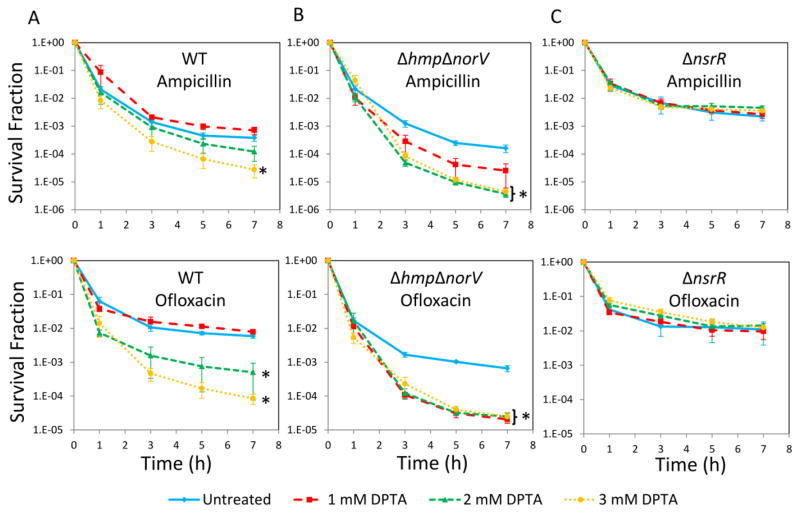
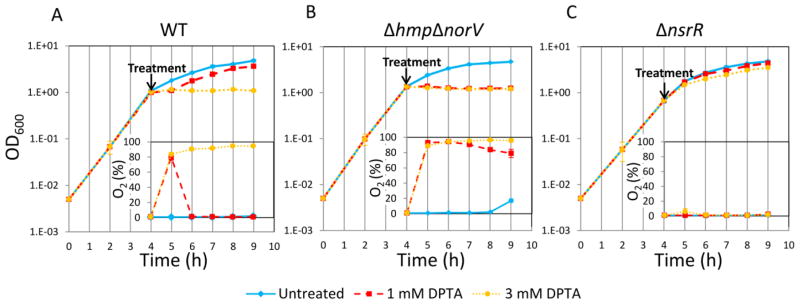
Bacterial persisters are phenotypic variants that survive extraordinary concentrations of antibiotics, and are thought to underlie the propensity of biofilm infections to relapse. Unfortunately many aspects of persister physiology remain ill-defined, which prevents progress toward eradicating the phenotype. Recently, we identified respiration within non-growing Escherichia coli populations as a potential target for the elimination type I persisters, which are those that arise from passage through stationary phase. Here we discovered that nitric oxide (NO) treatment at the onset of stationary phase significantly reduced type I persister formation through its ability to inhibit respiration. NO decreased protein and RNA degradation in stationary phase cells, and produced populations that were more fit for protein synthesis and growth resumption upon introduction into fresh media than untreated controls. Overall, this data shows that NO, which is a therapeutically-relevant compound, has the potential to decrease the incidence of recurrent infections from persisters.


Figures

Figure 1
Figure 1. Impact of NO on respiration and type I persister formation
A. Overnight cultures were diluted in fresh media, and cultured as described in Methods. Cell growth was monitored by measuring optical density at 600 nm (OD600). B. Percentages of dissolved oxygen concentrations with respect to saturated media in cultures with and without 3 mM DPTA treatment at t=4 h were quantified with an oxygen probe. C–D. Cell cultures at t=4 h were treated with 1 mM KCN or 3 mM DPTA. For controls, cell cultures were treated with equal volumes of solvent (0.15mM NaOH for DPTA, H2O for KCN). At t=24 h, cultures were washed to remove the chemical inhibitors, diluted (100-fold) in fresh LB, and treated with ampicillin or ofloxacin. Cell cultures at t=4 h (untreated early stationary phase) were similarly diluted and treated with ampicillin or ofloxacin in LB. Cell survival fractions were monitored for 7 h during the treatments. * indicates a statistical difference between control groups and DPTA-treated, KCN-treated, or early stationary phase cultures (P-value<0.05, t-test). The 7 hour time points of the survival data (final time points) were used for statistical analysis. At least three biological replicates were performed for each experimental condition. Each data point represents the mean value ± standard error.
Figure 2
Figure 2. Persister levels in anaerobic cultures
A. WT cell cultures at t=4 h were transferred to an anaerobic chamber without adding an electron acceptor and cultured anaerobically until t=24 h. For comparison, cells were cultured aerobically throughout the time course of the experiment. At t=24 h, cultures were diluted in fresh LB and treated with ampicillin or ofloxacin aerobically for 7 h. * indicates a statistical difference between aerobically and anaerobically grown cultures (P-value<0.05, t-test). B. NaNO3 (electron acceptor) at 40 mM was added to cultures at t=4 h. Then the cultures were treated with either 3 mM DPTA or the solvent (untreated), and transferred to an anaerobic chamber. At t=24 h, cultures were washed to remove the chemicals and diluted (100-fold) in fresh LB and treated with ampicillin or ofloxacin aerobically. Survival fractions were monitored for 7 h during the treatments. * indicates a statistical difference between control groups and DPTA treated cultures (P-value<0.05, t-test). The 7 hour time points of the survival data (final time points) were used for statistical analysis. At least three biological replicates were performed for each experimental condition. Each data point was denoted by mean value ± standard error.
Figure 3
Figure 3. Quantification of non-growing cell population after NO treatment
Cell cultures grown in LB with 1mM IPTG to induce mCherry protein were treated with 3 mM DPTA at t=4 h. For control groups (untreated), solvent was added to cultures. At t=24 h, cells were washed and diluted in fresh LB without inducer, and cultured for 2.5 h. A. mCherry at single cell level was determined by flow cytometry. At t=2.5 h mCherry levels were reduced in growing cells due to cell division, whereas it remained constant in non-growing cell populations. B. Percentages of non-growing cell populations in untreated or DPTA-treated cultures were determined at t=2.5 h. * indicates a statistical difference between untreated and DPTA treated groups (P-value<0.05, t-test). At least three biological replicates were performed for each experimental condition. Each data point represents the mean value ± standard error.
Figure 4
Figure 4. Protein production upon inoculation in fresh media
Cultures treated with 3 mM DPTA at t=4 h and untreated controls were grown until 24 h and then washed and diluted in fresh LB with inducer for GFP expression. A. GFP expression was monitored at indicated time points with flow cytometry. B. Fold increase in mean fluorescence values were plotted with respect to time. Fold increase has been quantified as the ratio of fluorescence at any time point to the fluorescence at t=0. * indicates a statistical difference between untreated and DPTA treated groups (P-value<0.05, t-test). At least three biological replicates were performed for each experimental condition. Each data point represents the mean value ± standard error.
Figure 5
Figure 5. Impact of NO on protein and RNA degradation in stationary phase
A. Cells carrying an IPTG-inducible, ssrA-tagged GFP were grown in the presence of inducer in both overnight and following cultures. At t=4 h, the inducer was removed, and the cultures were treated with 3 mM DPTA or left untreated. GFP levels were measured with a plate reader (Methods). Note that GFP in untreated cultures at t=8 h was not detectable. B–C. Total RNA were isolated from early stationary phase, DPTA-treated, and untreated late stationary phase cultures, and analyzed with a bioanalyzer. RNA integrity values range from 10 (intact) to 1 (totally degraded). For control groups (untreated), solvent was added to cultures. * indicates a statistical difference between untreated and DPTA treated groups (P-value<0.05, t-test). At least three biological replicates were performed for each experimental condition. Each data point represents the mean value ± standard error.
Figure 6
Figure 6. Persister levels of WT, ΔhmpΔnorV, and ΔnsrR
Cell cultures at t=4 h were treated with DPTA at indicated concentrations. For control groups (untreated), solvent was added to cultures. At t=24 h, persister assays were performed. A. Survival fractions of WT were monitored for 7 h during ampicillin and ofloxacin treatments. B. Survival fractions of ΔhmpΔnorV were monitored for 7 h during ampicillin and ofloxacin treatments. C. Survival fractions of ΔnsrR were monitored for 7 h during ampicillin and ofloxacin treatments. * indicates a statistical difference between untreated and DPTA treated groups (P-value<0.05, t-test). The 7 hour time points of the survival data (final time points) were used for statistical analysis. At least three biological replicates were performed for each experimental condition. Each data point represents the mean value ± standard error.
Figure 7
Figure 7. Growth and oxygen consumption of WT, ΔhmpΔnorV, and ΔnsrR following NO treatment
Cell cultures at t=4 h were treated with DPTA at indicated concentrations. A. Cell growth and oxygen utilization of WT were monitored at indicated time points. B. Cell growth and oxygen utilization of ΔhmpΔnorV were monitored at indicated time points. C. Cell growth and oxygen utilization of ΔnsrR were monitored at indicated time points. At least three biological replicates were performed for each experimental condition. Each data point represents the mean value ± standard error.

Similar articles

Cited by

References

    1. Adolfsen KJ, Brynildsen MP. A Kinetic Platform to Determine the Fate of Hydrogen Peroxide in Escherichia coli. Plos Computational Biology. 2015;11 - PMC - PubMed
    1. Amato SM, Orman MA, Brynildsen MP. Metabolic Control of Persister Formation in Escherichia coli. Molecular Cell. 2013;50:475–487. - PubMed
    1. Andrews JM. Determination of minimum inhibitory concentrations. Journal of Antimicrobial Chemotherapy. 2001;48:5–16. - PubMed
    1. Baba T, Ara T, Hasegawa M, Takai Y, Okumura Y, Baba M, Datsenko KA, Tomita M, Wanner BL, Mori H. Construction of Escherichia coli K-12 in-frame, single-gene knockout mutants: the Keio collection. Molecular Systems Biology. 2006;2:11. - PMC - PubMed
    1. Balaban NQ, Gerdes K, Lewis K, McKinney JD. A problem of persistence: still more questions than answers? Nature Reviews Microbiology. 2013;11:587–591. - PubMed

Publication types

MeSH terms